|
1500
|
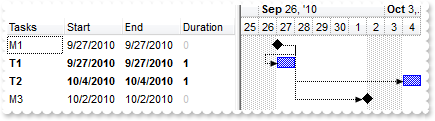
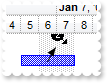
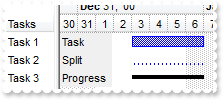
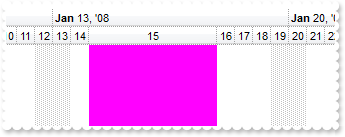
How can I add a Zero-Lenght bar
With G2antt1
	.BeginUpdate
	.MarkSearchColumn = False
	With .Columns
		.Add "Tasks"
		.Add("Start").Def(18) = 1
		.Add("End").Def(18) = 2
		.Add("Duration").Def(18) = 258
	End With
	With .Chart
		.FirstVisibleDate = #9/20/2010#
		.LevelCount = 2
		.PaneWidth(0) = 256
		.AllowLinkBars = False
	End With
	With .Items
		.AllowCellValueToItemBar = True
		h1 = .AddItem("M1")
		.AddBar h1,"Milestone",#9/29/2010#,#9/29/2010#
		.ItemBar(h1,"",20) = True
	End With
	.EndUpdate
End With
|
|
1499
|
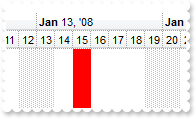
Can I use bars like Milestone (Zero-Length bar) in SchedulePDM
' BarResizing event - Occurs when a bar is moving or resizing.
Private Sub G2antt1_BarResizing(ByVal Item As Long, ByVal Key As Variant)
	With G2antt1
		Debug.Print( .Items.SchedulePDM(Item,Key) )
	End With
End Sub

With G2antt1
	.BeginUpdate
	.MarkSearchColumn = False
	With .Columns
		.Add "Tasks"
		.Add("Start").Def(18) = 1
		.Add("End").Def(18) = 543
		.Add("Duration").Def(18) = 258
	End With
	With .ConditionalFormats.Add("%3")
		.Bold = True
		.ApplyTo = -1
	End With
	With .ConditionalFormats.Add("%3 = 0")
		.ForeColor = RGB(196,196,196)
		.ApplyTo = 3 ' &H3
	End With
	With .Chart
		.FirstVisibleDate = #9/20/2010#
		.LevelCount = 2
		.PaneWidth(0) = 256
		.Bars.Add("Task:Split").Shortcut = "Task"
	End With
	With .Items
		.AllowCellValueToItemBar = True
		h1 = .AddItem("M1")
		.AddBar h1,"Milestone",#9/27/2010#,#9/27/2010#
		.ItemBar(h1,"",20) = True
		h2 = .AddItem("T1")
		.AddBar h2,"Task",#9/27/2010#,#9/27/2010#
		.ItemBar(h2,"",543) = #9/27/2010#
		.ItemBar(h2,"",20) = True
		.AddLink "L1",h1,"",h2,""
		h3 = .AddItem("T2")
		.AddBar h3,"Task",#9/27/2010#,#9/27/2010#
		.ItemBar(h3,"",543) = #9/27/2010#
		.ItemBar(h3,"",20) = True
		.AddLink "L2",h1,"",h3,""
		.Link("L2",16) = 5
		h4 = .AddItem("M3")
		.AddBar h4,"Milestone",#9/27/2010#,#9/27/2010#
		.ItemBar(h4,"",20) = False
		.AddLink "L3",h1,"",h4,""
		.Link("L3",16) = 5
		.SchedulePDM 0,""
	End With
	.EndUpdate
End With
|
|
1498
|
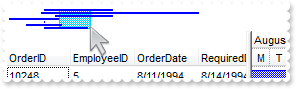
How can I prevent vertical scrolling when user clicks the overview part of the control
' AddItem event - Occurs after a new Item has been inserted to Items collection.
Private Sub G2antt1_AddItem(ByVal Item As Long)
	With G2antt1
		With .Items
			.AddBar Item,"Task",.CellValue(Item,2),.CellValue(Item,4)
		End With
	End With
End Sub

With G2antt1
	.BeginUpdate
	With .Chart
		.FirstVisibleDate = #8/3/1994#
		.PaneWidth(False) = 256
		.LevelCount = 2
		.UnitScale = 4096
		.FirstWeekDay = 1
		.OverviewVisible = 2
	End With
	.ColumnAutoResize = False
	.ContinueColumnScroll = False
	Set rs = CreateObject("ADOR.Recordset")
	With rs
		.Open "Orders","Provider=Microsoft.ACE.OLEDB.12.0;Data Source=C:\Program Files\Exontrol\ExG2antt\Sample\Access\misc.accdb",3,3
	End With
	.DataSource = rs
	.Items.AllowCellValueToItemBar = True
	.Columns.Item(2).Def(18) = 1
	.Columns.Item(4).Def(18) = 2
	.EndUpdate
End With
|
|
1497
|
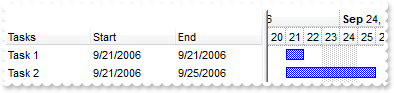
I need to specify the start and end dates of the bar to be the same, but no bars are shown. (recommended for bars with exBarKeepWorkingCount ) What I can do
With G2antt1
	.BeginUpdate
	.MarkSearchColumn = False
	With .Columns
		.Add "Tasks"
		.Add("Start").Def(18) = 1
		.Add("End").Def(18) = 543
	End With
	With .Chart
		.FirstVisibleDate = #9/20/2006#
		.LevelCount = 2
		.PaneWidth(0) = 256
		.ShowEmptyBars = 0
	End With
	With .Items
		.AllowCellValueToItemBar = True
		h = .AddItem("Task 1")
		.AddBar h,"Task",#9/21/2006#,#9/21/2006#
		.ItemBar(h,"",543) = .ItemBar(h,"",1)
		.ItemBar(h,"",20) = True
		h = .AddItem("Task 2")
		.AddBar h,"Task",#9/21/2006#,#9/21/2006#
		.ItemBar(h,"",543) = #9/25/2006#
		.ItemBar(h,"",20) = True
	End With
	.EndUpdate
End With
|
|
1496
|
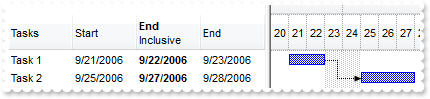
How can I display the end date to be the last visible date of task, instead the next day
' BarResize event - Occurs when a bar is moved or resized.
Private Sub G2antt1_BarResize(ByVal Item As Long, ByVal Key As Variant)
	With G2antt1
		.Items.SchedulePDM Item,Key
	End With
End Sub

' BarResizing event - Occurs when a bar is moving or resizing.
Private Sub G2antt1_BarResizing(ByVal Item As Long, ByVal Key As Variant)
	With G2antt1
		.Items.SchedulePDM Item,Key
	End With
End Sub

With G2antt1
	.BeginUpdate
	.MarkSearchColumn = False
	.HeaderHeight = 36
	With .Columns
		.Add "Tasks"
		.Add("Start").Def(18) = 1
		With .Add("End")
			.HTMLCaption = "<b>End</b><br>Inclusive"
			.Def(18) = 543
			.Editor.EditType = 7
		End With
		.Add("End").Def(18) = 2
	End With
	With .ConditionalFormats.Add(1)
		.Bold = True
		.ApplyTo = 2 ' &H2
	End With
	With .Chart
		.FirstVisibleDate = #9/20/2006#
		.LevelCount = 2
		.PaneWidth(0) = 256
		.Bars.Add("Task:Split").Shortcut = "Task"
	End With
	With .Items
		.AllowCellValueToItemBar = True
		h1 = .AddItem("Task 1")
		.AddBar h1,"Task",#9/21/2006#,#9/23/2006#
		h2 = .AddItem("Task 2")
		.AddBar h2,"Task",#9/21/2006#,#9/26/2006#
		.AddLink "link",h1,"",h2,""
		.ItemBar(0,"<*>",20) = True
		.SchedulePDM 0,""
	End With
	.EndUpdate
End With
|
|
1495
|
How do I hide the selection
With G2antt1
	.BeginUpdate
	.MarkSearchColumn = False
	.SelForeColor = .ForeColor
	.SelBackColor = .BackColor
	.ShowFocusRect = False
	With .Columns
		With .Add("Format")
			.FormatColumn = "type(value) in (0,1) ? 'null' : ( dbl(value)<0 ? '<fgcolor=FF0000>'+ (value format '2|.|3|,|1' ) : (dbl(value)>0 ? '<fgcolor=00" & _
	"00FF>+'+(value format '2|.|3|,' ): '0.00') )"
			.Def(17) = 1
		End With
	End With
	With .Items
		.AddItem 10
		.AddItem -8
	End With
	.EndUpdate
End With
|
|
1494
|
How do I access the cells, or how do I get the values in the columns
With G2antt1
	With .Columns
		.Add "C1"
		.Add "C2"
		.Add "C3"
	End With
	With .Items
		h = .AddItem("Item 1")
		.CellValue(h,1) = "SubItem 1.1"
		.CellValue(h,2) = "SubItem 1.2"
		Debug.Print( .CellValue(h,1) )
	End With
End With
|
|
1493
|
Is there any function I can use to indicate the Now() when using the ComputedFields, CondtionalFormats, ...
With G2antt1
	.Columns.Add("Now").ComputedField = "date(``)"
	.Items.AddItem ""
End With
|
|
1492
|
How can I get the start and end points of the bar once the BarResize event occurs
' BarResize event - Occurs when a bar is moved or resized.
Private Sub G2antt1_BarResize(ByVal Item As Long, ByVal Key As Variant)
	With G2antt1
		Debug.Print( "Start: " )
		Debug.Print( .Items.ItemBar(Item,Key,1) )
		Debug.Print( "End: " )
		Debug.Print( .Items.ItemBar(Item,Key,2) )
	End With
End Sub

With G2antt1
	.BeginUpdate
	With .Chart
		.FirstVisibleDate = #12/31/2009#
		.LevelCount = 2
		.PaneWidth(False) = 96
		Set var_Bar = .Bars.Item("Task")
	End With
	.Columns.Add "Types"
	With .Items
		.AddBar .AddItem("Task 1"),"Task",#1/4/2010#,#1/9/2010#,""
		.AddBar .AddItem("Task 2"),"Task",#1/4/2010#,#1/9/2010#,""
	End With
	.EndUpdate
End With
|
|
1491
|
My chart displays hours, the question would be if possible to let user resizes the bars up to 1/2 hour, or a half an hour
With G2antt1
	.BeginUpdate
	.DefaultItemHeight = 22
	.Columns.Add "Task"
	With .Chart
		.AllowCreateBar = 1
		.LevelCount = 2
		.UnitScale = 65536
		.ResizeUnitScale = 1048576
		.ResizeUnitCount = 30
		.PaneWidth(False) = 48
		.FirstVisibleDate = #1/1/2001#
		.DrawGridLines = -1
		.Level(1).DrawGridLines = -1
	End With
	With .Items
		.AddItem "Task"
		.AddItem "Task"
		.AddItem "Task"
		.AddItem "Task"
		.AddItem "Task"
	End With
	.EndUpdate
End With
|
|
1490
|
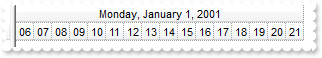
How can I show the dates in the title
With G2antt1
	.BeginUpdate
	With .Chart
		.FirstVisibleDate = #12/30/2002#
		.LevelCount = 2
		.PaneWidth(False) = 0
		.UnitScale = 65536
		.DrawGridLines = -1
		.Level(0).Alignment = 17 ' AlignmentEnum.exHOutside Or AlignmentEnum.CenterAlignment
	End With
	.EndUpdate
End With
|
|
1489
|
If I vertically scroll the control the image flows fluently. But when I scroll on the horizontal chart's scrollbar the images only shows after I release the click button. Can I make it scroll fluently like the vertical scrollbar
With G2antt1
	.Chart.PaneWidth(False) = 0
	.Chart.ToolTip = ""
End With
|
|
1488
|
How can I programmatically add a bar during the CreateBar event
' CreateBar event - Fired when the user creates a new bar.
Private Sub G2antt1_CreateBar(ByVal Item As Long, ByVal DateStart As Date, ByVal DateEnd As Date)
	With G2antt1
		With .Items
			k = .ItemBar(Item,"",256)
			.AddBar Item,"Order",DateStart,DateEnd,k,"your text"
		End With
		Debug.Print( .Items.ItemBar(Item,"",256) )
	End With
End Sub

With G2antt1
	.BeginUpdate
	.Columns.Add "Tasks"
	With .Chart
		.AllowCreateBar = -1
		.PaneWidth(False) = 48
		.FirstVisibleDate = #12/28/2000#
		.LevelCount = 2
		.Bars.Copy "Task","Order"
	End With
	With .Items
		.AddItem 1
		.AddItem 2
		.AddItem 3
	End With
	.EndUpdate
End With
|
|
1487
|
How can I move more bars by code
With G2antt1
	.Columns.Add "Tasks"
	With .Chart
		.FirstVisibleDate = #1/1/2001#
		.LevelCount = 2
		.PaneWidth(False) = 48
	End With
	With .Items
		.AddBar .AddItem("Task 1"),"Task",#1/1/2001#,#1/6/2001#,"A"
		.AddBar .AddItem("Task 2"),"Task",#1/2/2001#,#1/7/2001#,"B"
		.ItemBar(0,"<*>",514) = 1
		.ItemBar(0,"<A*>",514) = 1
		.ItemBar(0,"<B*>",514) = 1
	End With
End With
|
|
1486
|
How can I move a bar by code
With G2antt1
	.Columns.Add "Tasks"
	With .Chart
		.FirstVisibleDate = #1/1/2001#
		.LevelCount = 2
		.PaneWidth(False) = 48
	End With
	With .Items
		h = .AddItem("Task 1")
		.AddBar h,"Task",#1/1/2001#,#1/6/2001#,"A"
		.ItemBar(h,"A",514) = 1
	End With
End With
|
|
1485
|
How can I clip the notes to the items zone only
With G2antt1
	.BeginUpdate
	.Images "gBJJgBAIDAAGAAEAAQhYAf8Pf4hh0QihCJo2AEZjQAjEZFEaIEaEEaAIAkcbk0olUrlktl0vmExmUzmk1m03nE5nU7nk9n0/oFBoVDolFo1HpFJpVLplNp1PqFRqVTq" & _
	"lVq1XrFZrVbrldr1fsFhsVjslls1ntFptVrtltt1vuFxuVzul1u13vF5vV7vl9v1/wGBwWDwmFw2HxGJxWLxmNx0xiFdyOTh8Tf9ZymXx+QytcyNgz8r0OblWjyWds+m" & _
	"0ka1Vf1ta1+r1mos2xrG2xeZ0+a0W0qOx3GO4NV3WeyvD2XJ5XL5nN51aiw+lfSj0gkUkAEllHanHI5j/cHg8EZf7w8vl8j4f/qfEZeB09/vjLAB30+kZQAP/P5/H6/y" & _
	"NAOAEAwCjMBwFAEDwJBMDwLBYAP2/8Hv8/gAGAD8LQs9w/nhDY/oygIA="
	.AntiAliasing = True
	.Columns.Add "Task"
	With .Chart
		.FirstVisibleDate = #1/1/2001#
		.PaneWidth(False) = 96
		.LevelCount = 2
	End With
	With .Items
		.AddItem
		h = .AddItem("Task 1")
		.AddBar h,"Task",#1/5/2001#,#1/8/2001#,"1"
	End With
	With .Chart.Notes
		With .Add("1",G2antt1.Items.ItemByIndex(1),"1","<img>2</img>")
			.PartShadow(1) = False
			.PartBorderSize(1) = 0
			.ClearPartBackColor 1
			.PartCanMove(1) = True
			.RelativePosition = 0.5
			.PartVOffset(1) = -36
		End With
		.ClipTo = 2
	End With
	.EndUpdate
End With
|
|
1484
|
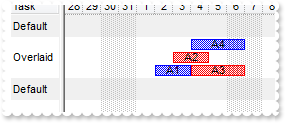
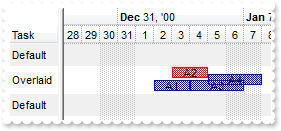
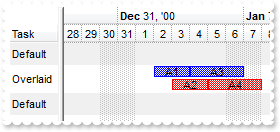
How can I put two bars of various types, in the event of conflict do not coincide
With G2antt1
	.BeginUpdate
	.DefaultItemHeight = 22
	.Columns.Add "Task"
	.ScrollBySingleLine = True
	.BackColorAlternate = RGB(240,240,240)
	With .Chart
		.PaneWidth(False) = 48
		.FirstVisibleDate = #12/28/2000#
		.LevelCount = 2
		With .Bars.Item("Task")
			.OverlaidType = 515 ' OverlaidBarsTypeEnum.exOverlaidBarsStackAutoArrange Or OverlaidBarsTypeEnum.exOverlaidBarsStack
			.OverlaidGroup = "NewTask"
		End With
		With .Bars.Copy("Task","NewTask")
			.OverlaidType = 515 ' OverlaidBarsTypeEnum.exOverlaidBarsStackAutoArrange Or OverlaidBarsTypeEnum.exOverlaidBarsStack
			.OverlaidGroup = "Task"
			.Color = RGB(255,0,0)
		End With
	End With
	With .Items
		h1 = .AddItem("Default")
		h = .AddItem("Overlaid")
		.AddBar h,"Task",#1/2/2001#,#1/4/2001#,"A1","A1"
		.AddBar h,"NewTask",#1/3/2001#,#1/5/2001#,"A2","A2"
		.AddBar h,"NewTask",#1/4/2001#,#1/7/2001#,"A3","A3"
		.AddBar h,"Task",#1/4/2001#,#1/7/2001#,"A4","A4"
		h1 = .AddItem("Default")
	End With
	.EndUpdate
End With
|
|
1483
|
How can I run trigger an event which, after clicking on the item/bar gives the key/name or item id
' MouseDown event - Occurs when the user presses a mouse button.
Private Sub G2antt1_MouseDown(ByVal Button As Integer, ByVal Shift As Integer, ByVal X As Long, ByVal Y As Long)
	With G2antt1
		item = .ItemFromPoint(-1,-1,column,hit)
		key = .Chart.BarFromPoint(-1,-1)
		Debug.Print( "Item:" )
		Debug.Print( item )
		Debug.Print( "Key:" )
		Debug.Print( key )
		Debug.Print( "CellValue(i,0):" )
		Debug.Print( .Items.CellValue(item,0) )
		.Items.ItemBar(item,key,33) = 255
	End With
End Sub

With G2antt1
	.BeginUpdate
	.Columns.Add "Task"
	With .Chart
		.FirstVisibleDate = #12/29/2000#
		.PaneWidth(False) = 64
		.LevelCount = 2
	End With
	With .Items
		h1 = .AddItem("Task 1")
		.AddBar h1,"Task",#1/2/2001#,#1/4/2001#,"K1"
		h2 = .AddItem("Task 2")
		.AddBar h2,"Task",#1/4/2001#,#1/6/2001#,"K2"
		.AddLink "L1",h1,"K1",h2,"K2"
		h3 = .AddItem("Task 3")
		.AddBar h3,"Task",#1/8/2001#,#1/10/2001#,"K3"
		.AddLink "L2",h2,"K2",h3,"K3"
	End With
	.EndUpdate
End With
|
|
1482
|
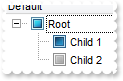
How can I change the check-boxes appearance
With G2antt1
	.LinesAtRoot = -1
	With .Columns.Add("Default")
		.Def(0) = True
		.PartialCheck = True
	End With
	With .Items
		h = .AddItem("Root")
		.InsertItem h,,"Child 1"
		.InsertItem h,,"Child 2"
		.ExpandItem(h) = True
	End With
	With .VisualAppearance
		.Add 1,"XP:Button 3 12"
		.Add 2,"XP:Button 3 11"
		.Add 3,"XP:Button 3 10"
	End With
	.CheckImage(0) = 16777216
	.CheckImage(1) = 33554432
	.CheckImage(2) = 50331648
End With
|
|
1481
|
How can I change the color for the control's split bar (sample 1)
With G2antt1
	.BeginUpdate
	.Columns.Add "Default"
	.Background(18) = RGB(0,0,1)
	.BackColorLevelHeader = .BackColor
	With .Chart
		.LevelCount = 2
		.PaneWidth(False) = 64
		.HistogramVisible = True
		.HistogramHeight = 64
		.OverviewHeight = 48
		.OverviewVisible = -1
	End With
	.EndUpdate
End With
|
|
1480
|
Is it possible to display ONLY the working hours
With G2antt1
	With .Chart
		.FirstVisibleDate = #1/1/2001#
		.LevelCount = 2
		With .Level(0)
			.Label = 4096
			.Alignment = 17 ' AlignmentEnum.exHOutside Or AlignmentEnum.CenterAlignment
		End With
		With .Level(1)
			.Label = "<%hh%>"
			.Count = 6
		End With
		.UnitWidth = 26
		.PaneWidth(False) = 0
		.NonworkingHours = 15728895
		.ShowNonworkingUnits = False
		.ShowNonworkingHours = False
	End With
End With
|
|
1479
|
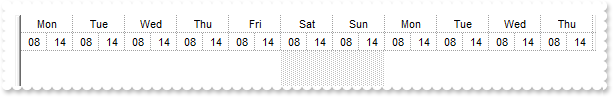
How can I display the end of the day in the chart's header
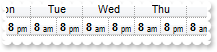
With G2antt1
	With .Chart
		.FirstVisibleDate = #1/1/2001#
		.LevelCount = 2
		With .Level(0)
			.Label = 4096
			.Alignment = 17 ' AlignmentEnum.exHOutside Or AlignmentEnum.CenterAlignment
		End With
		With .Level(1)
			.Label = "<%hh%>"
			.Count = 6
			.ReplaceLabel("08") = "<b>8</b> <font ;6>am"
			.ReplaceLabel("14") = "<b>8</b> <font ;6>pm"
		End With
		.UnitWidth = 26
		.PaneWidth(False) = 0
		.NonworkingHours = 15728895
		.ShowNonworkingUnits = False
		.ShowNonworkingHours = False
	End With
End With
|
|
1478
|
How can I display the +/- expanding buttons in the chart section
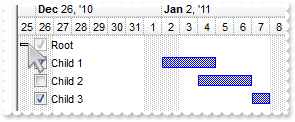
With G2antt1
	.BeginUpdate
	.LinesAtRoot = -1
	.Indent = 13
	.HasButtons = 3
	With .Chart
		.FirstVisibleDate = #12/25/2010#
		.LevelCount = 2
		.PaneWidth(False) = 0
		.ColumnsFormatLevel = "0"
		.SelBackColor = G2antt1.SelBackColor
		.SelForeColor = G2antt1.SelForeColor
	End With
	With .Columns.Add("P1")
		.Def(0) = True
		.PartialCheck = True
	End With
	With .Items
		h = .AddItem("Root")
		.AddBar .InsertItem(h,,"Child 1"),"Task",#1/2/2011#,#1/5/2011#
		.AddBar .InsertItem(h,,"Child 2"),"Task",#1/4/2011#,#1/7/2011#
		.AddBar .InsertItem(h,,"Child 3"),"Task",#1/7/2011#,#1/8/2011#
		.ExpandItem(h) = True
	End With
	.EndUpdate
End With
|
|
1477
|
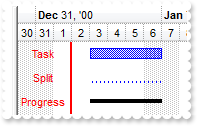
Is it possible to display the columns in the chart aligned to the right
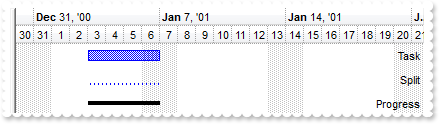
With G2antt1
	.BeginUpdate
	.DefaultItemHeight = 24
	.Columns.Add "Tasks"
	With .Columns.Add("Key")
		.Def(18) = 0
		.Visible = False
		.Alignment = 2
	End With
	With .Chart
		.FirstVisibleDate = #12/30/2000#
		.LevelCount = 2
		.PaneWidth(False) = 0
		.ColumnsFormatLevel = "|,1:52"
	End With
	With .Items
		.AllowCellValueToItemBar = True
		.AddBar .AddItem("Task 1"),"Task",#1/3/2001#,#1/7/2001#
		.AddBar .AddItem("Task 2"),"Split",#1/3/2001#,#1/7/2001#
		.AddBar .AddItem("Task 3"),"Progress",#1/3/2001#,#1/7/2001#
	End With
	.EndUpdate
End With
|
|
1476
|
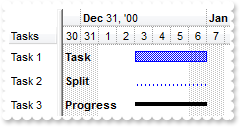
How can I display a border in the chart
With G2antt1
	.BeginUpdate
	.DefaultItemHeight = 24
	.Columns.Add "Tasks"
	With .Columns.Add("Key")
		.Def(18) = 0
		.Visible = False
		.Alignment = 1
		.Def(5) = 255
	End With
	With .Chart
		.FirstVisibleDate = #12/30/2000#
		.LevelCount = 2
		.PaneWidth(False) = 0
		.ColumnsFormatLevel = "1:52,\""\""[bg=255]:2"
	End With
	With .Items
		.AllowCellValueToItemBar = True
		.AddBar .AddItem("Task 1"),"Task",#1/3/2001#,#1/7/2001#
		.AddBar .AddItem("Task 2"),"Split",#1/3/2001#,#1/7/2001#
		.AddBar .AddItem("Task 3"),"Progress",#1/3/2001#,#1/7/2001#
	End With
	.EndUpdate
End With
|
|
1475
|
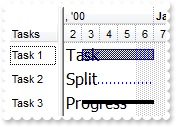
How can I change the font to display the columns in the chart (Method 2)
With G2antt1
	.BeginUpdate
	.DefaultItemHeight = 24
	.Columns.Add "Tasks"
	With .Columns.Add("Key")
		.Def(18) = 0
		.Visible = False
	End With
	With .ConditionalFormats.Add(1)
		.Bold = True
		.ApplyTo = 1 ' &H1
	End With
	With .Chart
		.FirstVisibleDate = #12/30/2000#
		.LevelCount = 2
		.PaneWidth(False) = 48
		.ColumnsFormatLevel = "1"
	End With
	With .Items
		.AllowCellValueToItemBar = True
		.AddBar .AddItem("Task 1"),"Task",#1/3/2001#,#1/7/2001#
		.AddBar .AddItem("Task 2"),"Split",#1/3/2001#,#1/7/2001#
		.AddBar .AddItem("Task 3"),"Progress",#1/3/2001#,#1/7/2001#
	End With
	.EndUpdate
End With
|
|
1474
|
How can I change the font to display the columns in the chart (Method 1)
With G2antt1
	.BeginUpdate
	.DefaultItemHeight = 24
	.Columns.Add "Tasks"
	With .Columns.Add("Key")
		.Def(18) = 0
		.Visible = False
	End With
	With .Chart
		.FirstVisibleDate = #12/30/2000#
		.LevelCount = 2
		.PaneWidth(False) = 48
		.ColumnsFormatLevel = "1"
		.ColumnsFont = G2antt1.Font
		With .ColumnsFont
			.Size = 12
			.Name = "Tahoma"
		End With
	End With
	With .Items
		.AllowCellValueToItemBar = True
		.AddBar .AddItem("Task 1"),"Task",#1/3/2001#,#1/7/2001#
		.AddBar .AddItem("Task 2"),"Split",#1/3/2001#,#1/7/2001#
		.AddBar .AddItem("Task 3"),"Progress",#1/3/2001#,#1/7/2001#
	End With
	.EndUpdate
End With
|
|
1473
|
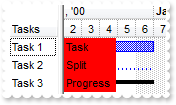
How can I change the column's background color when it is displayed on the chart (Method 2)
With G2antt1
	.BeginUpdate
	.Columns.Add "Tasks"
	With .Columns.Add("Key")
		.Def(18) = 0
		.Visible = False
	End With
	With .Chart
		.FirstVisibleDate = #12/30/2000#
		.LevelCount = 2
		.PaneWidth(False) = 48
		.ColumnsFormatLevel = "1[bg=255]:52"
	End With
	With .Items
		.AllowCellValueToItemBar = True
		.AddBar .AddItem("Task 1"),"Task",#1/3/2001#,#1/7/2001#
		.AddBar .AddItem("Task 2"),"Split",#1/3/2001#,#1/7/2001#
		.AddBar .AddItem("Task 3"),"Progress",#1/3/2001#,#1/7/2001#
	End With
	.EndUpdate
End With
|
|
1472
|
How can I change the column's background color when it is displayed on the chart (Method 1)
With G2antt1
	.BeginUpdate
	.Columns.Add "Tasks"
	With .Columns.Add("Key")
		.Def(18) = 0
		.Visible = False
		.Def(4) = 15790320
	End With
	With .Chart
		.FirstVisibleDate = #12/30/2000#
		.LevelCount = 2
		.PaneWidth(False) = 48
		.ColumnsFormatLevel = "1:52"
	End With
	With .Items
		.AllowCellValueToItemBar = True
		.AddBar .AddItem("Task 1"),"Task",#1/3/2001#,#1/7/2001#
		.AddBar .AddItem("Task 2"),"Split",#1/3/2001#,#1/7/2001#
		.AddBar .AddItem("Task 3"),"Progress",#1/3/2001#,#1/7/2001#
	End With
	.EndUpdate
End With
|
|
1471
|
Can the chart display any column
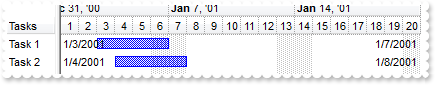
With G2antt1
	.BeginUpdate
	.Columns.Add "Tasks"
	With .Columns.Add("Start")
		.Def(18) = 1
		.Visible = False
		.Alignment = 0
	End With
	With .Columns.Add("End")
		.Def(18) = 2
		.Visible = False
		.Alignment = 2
	End With
	With .Chart
		.FirstVisibleDate = #1/1/2001#
		.LevelCount = 2
		.PaneWidth(False) = 48
		.ColumnsFormatLevel = "1:52,|,2:52"
	End With
	With .Items
		.AllowCellValueToItemBar = True
		.AddBar .AddItem("Task 1"),"Task",#1/3/2001#,#1/7/2001#
		.AddBar .AddItem("Task 2"),"Task",#1/4/2001#,#1/8/2001#
	End With
	.EndUpdate
End With
|
|
1470
|
Is it possible to display a check-box column on the chart
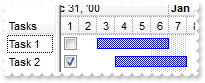
With G2antt1
	.Columns.Add "Tasks"
	With .Columns.Add("Check")
		.Def(0) = True
		.Visible = False
	End With
	With .Chart
		.FirstVisibleDate = #1/1/2001#
		.LevelCount = 2
		.PaneWidth(False) = 48
		.ColumnsFormatLevel = "1"
	End With
	With .Items
		.AddBar .AddItem("Task 1"),"Task",#1/3/2001#,#1/7/2001#
		.AddBar .AddItem("Task 2"),"Task",#1/4/2001#,#1/8/2001#
	End With
End With
|
|
1469
|
Is it possible to disable the cell's editor context menu
With G2antt1
	With .Columns.Add("Edit").Editor
		.EditType = 1
		.Option(202) = False
	End With
	With .Items
		.AddItem 10
		.AddItem 20
	End With
End With
|
|
1468
|
How can I find a value in a drop down editor
With G2antt1
	With .Columns.Add("DropDownList").Editor
		.EditType = 3
		.AddItem 1,"DDList 1"
		.AddItem 2,"DDList 2"
		.AddItem 3,"DDList 3"
	End With
	With .Columns.Add("DropDown").Editor
		.EditType = 2
		.AddItem 1,"DDType 1"
		.AddItem 2,"DDType 2"
		.AddItem 3,"DDType 3"
	End With
	With .Items
		.CellValue(.AddItem(1),1) = G2antt1.Columns.Item(1).Editor.FindItem(1)
		.CellValue(.AddItem(2),1) = G2antt1.Columns.Item(1).Editor.FindItem(2)
	End With
End With
|
|
1467
|
What is the difference between DropDownType and DropDownListType
With G2antt1
	With .Columns.Add("DropDownList").Editor
		.EditType = 3
		.AddItem 1,"First item"
		.AddItem 2,"Second item"
		.AddItem 3,"Third item"
	End With
	With .Columns.Add("DropDown").Editor
		.EditType = 2
		.AddItem 1,"First item"
		.AddItem 2,"Second item"
		.AddItem 3,"Third item"
	End With
	With .Items
		.CellValue(.AddItem(1),1) = "Any"
		.CellValue(.AddItem(2),1) = "Any"
	End With
End With
|
|
1466
|
How can I mark or enlarge the selected bars, so I have a clear frame around (Method 3)
With G2antt1
	.BeginUpdate
	.DefaultItemHeight = 32
	With .VisualAppearance
		.Add 1,"c:\exontrol\images\normal.ebn"
		.Add 2,"CP:1 -2 -2 2 2"
	End With
	With .Chart
		.PaneWidth(0) = 48
		.FirstVisibleDate = #1/1/2002#
		.SelBarColor = &H2ff0000
		.Bars.Item("Task").Color = &H1000000
	End With
	.Columns.Add "Task"
	With .Items
		h = .AddItem("Task 1")
		.AddBar h,"Task",#1/2/2002#,#1/4/2002#,"A"
		.AddBar h,"Task",#1/6/2002#,#1/10/2002#,"B"
		.AddBar h,"Task",#1/11/2002#,#1/14/2002#,"C"
		.ItemBar(h,"A",257) = True
		.ItemBar(h,"B",257) = True
	End With
	.EndUpdate
End With
|
|
1465
|
How can I mark or enlarge the selected bars, so I have a clear frame around (Method 2)
With G2antt1
	.BeginUpdate
	.DefaultItemHeight = 32
	With .VisualAppearance
		.Add 1,"c:\exontrol\images\normal.ebn"
		.Add 2,"CP:1 -2 -2 2 2"
	End With
	With .Chart
		.PaneWidth(0) = 48
		.FirstVisibleDate = #1/1/2002#
		.SelBarColor = &H2000000
		.Bars.Item("Task").Color = &H1000000
	End With
	.Columns.Add "Task"
	With .Items
		h = .AddItem("Task 1")
		.AddBar h,"Task",#1/2/2002#,#1/4/2002#,"A"
		.AddBar h,"Task",#1/6/2002#,#1/10/2002#,"B"
		.AddBar h,"Task",#1/11/2002#,#1/14/2002#,"C"
		.ItemBar(h,"A",257) = True
		.ItemBar(h,"B",257) = True
	End With
	.EndUpdate
End With
|
|
1464
|
How can I mark or enlarge the selected bars, so I have a clear frame around (Method 1)
With G2antt1
	.BeginUpdate
	.DefaultItemHeight = 32
	With .VisualAppearance
		.Add 1,"gBFLBCJwBAEHhEJAEGg4BNkMQAAYAQGKIYBkAKBQAGaAoDDYNQwQwAAwjIKEEwsACEIrjKCVIgkHYJRjGEZxMAsEwjAoaQChEZRUhEMgxDDIIxAJIcaw0GSEZwgOQZB" & _
	"iOEYnDANMgzDLMZR7DajYymSA6LiKNo+QjKFB0NLMVRtEIIIzCSCaNomT4DS4NIi2DYcVhhMqBYbtCZZBo2FpZUxXdL0BJMVxbHKYJikW4pVjoAJ+TxccjVDQNJyLQ6r" & _
	"YzuAAKNpuO58RbdGDQHA9KyfLCEcTxYAMbp6X5kaBZVp2VCMRzbTLUIDzPNVCTrNIaJioAaMeiCG5NUzieqRNalLABFjZMIHDbtGynDIJZruW52+CLIZpWbEOiRXr2Tx" & _
	"xgGYp5Fie5mAYBgIgSFDrDOIZUmQZYiECXJUjIEQ3lUGgbEIRQcg+Hg8DEFxYFuOR/i+X5znufh/omBgCgCVwjn4BoBmCCAmAqApgkefgMgOYQID4DoELsUgTgUYYIC4" & _
	"F4GGGSAaBuBxhhgfgggUYgog4EYJGIaBJn6ChiBiLgsgkIpoj4J4BCMSJWDaDZjgiZgCEAQCAgA=="
		.Add 2,"CP:1 -2 -2 2 2"
	End With
	With .Chart
		.FirstVisibleDate = #1/1/2002#
		.SelBarColor = &H2000000
		.PaneWidth(0) = 48
	End With
	.Columns.Add "Task"
	With .Items
		h = .AddItem("Task 1")
		.AddBar h,"Task",#1/2/2002#,#1/4/2002#,"A"
		.AddBar h,"Task",#1/6/2002#,#1/10/2002#,"B"
		.AddBar h,"Task",#1/11/2002#,#1/14/2002#,"C"
		.ItemBar(h,"A",257) = True
		.ItemBar(h,"B",257) = True
	End With
	.EndUpdate
End With
|
|
1463
|
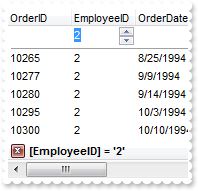
How can I load my table from an Access 2007, using ADO
' AddItem event - Occurs after a new Item has been inserted to Items collection.
Private Sub G2antt1_AddItem(ByVal Item As Long)
	With G2antt1
		With .Items
			.AddBar Item,"Task",.CellValue(Item,2),.CellValue(Item,4)
		End With
	End With
End Sub

With G2antt1
	.BeginUpdate
	With .Chart
		.FirstVisibleDate = #8/3/1994#
		.PaneWidth(False) = 256
		.LevelCount = 2
		.UnitScale = 4096
		.FirstWeekDay = 1
		.OverviewVisible = 2
	End With
	.ColumnAutoResize = False
	.ContinueColumnScroll = False
	Set rs = CreateObject("ADOR.Recordset")
	With rs
		.Open "Orders","Provider=Microsoft.ACE.OLEDB.12.0;Data Source=C:\Program Files\Exontrol\ExG2antt\Sample\Access\misc.accdb",3,3
	End With
	.DataSource = rs
	.Items.AllowCellValueToItemBar = True
	.Columns.Item(2).Def(18) = 1
	.Columns.Item(4).Def(18) = 2
	.EndUpdate
End With
|
|
1462
|
Is it possible to enumerate the links without enumerating them
With G2antt1
	.AntiAliasing = True
	.Columns.Add "Task"
	With .Chart
		.FirstVisibleDate = #1/1/2001#
		.PaneWidth(False) = 128
		.NonworkingDays = 0
		.LinksWidth = 2
	End With
	With .Items
		h1 = .AddItem("Task 1")
		.AddBar h1,"Task",#1/2/2001#,#1/4/2001#,"K1"
		h2 = .AddItem("Task 2")
		.AddBar h2,"Task",#1/6/2001#,#1/8/2001#,"K2"
		.AddLink "L1",h1,"K1",h2,"K2"
		h3 = .AddItem("Task 3")
		.AddBar h3,"Task",#1/10/2001#,#1/12/2001#,"K3"
		.AddLink "L2",h2,"K2",h3,"K3"
		h4 = .AddItem("Task 4")
		.AddBar h4,"Task",#1/14/2001#,#1/16/2001#,"K4"
		.AddLink "L3",h3,"K3",h4,"K4"
		.Link("<L*>",11) = False
	End With
End With
|
|
1461
|
How can I display a vertical line in the chart
' Click event - Occurs when the user presses and then releases the left mouse button over the tree control.
Private Sub G2antt1_Click()
	With G2antt1
		With .Chart
			.MarkNowColor = RGB(255,0,0)
			.MarkNow = .DateFromPoint(-1,-1)
		End With
	End With
End Sub

With G2antt1
	With .Chart
		.FirstVisibleDate = #3/13/2012#
		.PaneWidth(False) = 0
		.LevelCount = 2
		.MarkNowColor = RGB(0,0,0)
		.MarkNowWidth = 3
		.UnitWidth = 32
		.ResizeUnitScale = 65536
	End With
End With
|
|
1460
|
How can I use the MarkNowColor to mark a time line different then the time on the machine
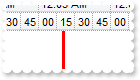
With G2antt1
	With .Chart
		.FirstVisibleDate = #3/13/2012#
		.PaneWidth(False) = 0
		.LevelCount = 2
		.Level(0).Label = 1048576
		With .Level(1)
			.Label = "<%ss%>"
			.Count = 15
		End With
		.MarkNowColor = RGB(255,0,0)
		.MarkNowWidth = 3
		.MarkNow = #3/13/2012 0:03:20 AM#
	End With
End With
|
|
1459
|
Is it possible to show the current date time using a delay
With G2antt1
	With .Chart
		.PaneWidth(False) = 0
		.LevelCount = 2
		.Level(0).Label = 1048576
		With .Level(1)
			.Label = "<%ss%>"
			.Count = 15
		End With
		.MarkNowColor = RGB(0,0,255)
		.MarkNowWidth = 3
		.MarkNowDelay = 0.00069444
	End With
	.Columns.Add "Tasks"
	With .Items
		.AddBar .AddItem("Item 1"),"Task",#1/1/2008#,#1/1/2018#
	End With
End With
|
|
1458
|
What are the options to show the links between bars
With G2antt1
	.AntiAliasing = True
	.Columns.Add "Task"
	With .Chart
		.FirstVisibleDate = #1/1/2001#
		.PaneWidth(False) = 128
		.NonworkingDays = 0
		.LinksWidth = 2
	End With
	With .Items
		h1 = .AddItem("Task 1")
		.AddItem ""
		.AddBar h1,"Task",#1/2/2001#,#1/4/2001#,"K1"
		h2 = .AddItem("Task 2")
		.AddItem ""
		.AddBar h2,"Task",#1/6/2001#,#1/8/2001#,"K2"
		.AddLink "L1",h1,"K1",h2,"K2"
		h3 = .AddItem("Task 3")
		.AddItem ""
		.AddBar h3,"Task",#1/12/2001#,#1/14/2001#,"K3"
		.AddLink "L2",h2,"K2",h3,"K3"
		.Link("L2",15) = -1
		h4 = .AddItem("Task 4")
		.AddBar h4,"Task",#1/18/2001#,#1/20/2001#,"K4"
		.AddLink "L3",h3,"K3",h4,"K4"
		.Link("L3",15) = 1
		.AddItem ""
		h5 = .AddItem("Task 5")
		.AddBar h5,"Task",#1/22/2001#,#1/24/2001#,"K5"
		.AddLink "L4",h4,"K4",h5,"K5"
		.Link("L4",15) = 2
	End With
End With
|
|
1457
|
Is it possible to specify the link between bars to be a wider line
With G2antt1
	.Columns.Add "Task"
	With .Chart
		.FirstVisibleDate = #1/1/2001#
		.PaneWidth(False) = 128
		.NonworkingDays = 0
		.LinksStyle = 0
		.LinksWidth = 2
		.LinksColor = RGB(255,0,0)
	End With
	With .Items
		h1 = .AddItem("Task 1")
		.AddBar h1,"Task",#1/2/2001#,#1/4/2001#,"K1"
		h2 = .AddItem("Task 2")
		.AddBar h2,"Task",#1/6/2001#,#1/8/2001#,"K2"
		.AddLink "L1",h1,"K1",h2,"K2"
		h3 = .AddItem("Task 3")
		.AddBar h3,"Task",#1/10/2001#,#1/12/2001#,"K3"
		.AddLink "L2",h2,"K2",h3,"K3"
	End With
End With
|
|
1456
|
Is it possible to create a link between the two specified bars so that the link was a straight line
With G2antt1
	.Columns.Add "Task"
	.AntiAliasing = True
	With .Chart
		.FirstVisibleDate = #1/1/2001#
		.PaneWidth(False) = 128
		.NonworkingDays = 0
	End With
	With .Items
		h1 = .AddItem("Task 1")
		.AddBar h1,"Task",#1/2/2001#,#1/4/2001#,"K1"
		h2 = .AddItem("Task 2")
		.AddBar h2,"Task",#1/6/2001#,#1/8/2001#,"K2"
		.AddLink "L1",h1,"K1",h2,"K2"
		.Link("L1",9) = 0
		.Link("L1",10) = 2
		.Link("L1",8) = 255
		.Link("L1",15) = 2
		h3 = .AddItem("Task 3")
		.AddBar h3,"Task",#1/10/2001#,#1/12/2001#,"K3"
		.AddLink "L2",h2,"K2",h3,"K3"
	End With
End With
|
|
1455
|
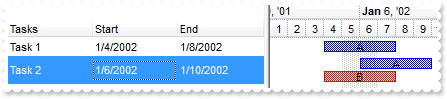
I associate the bars with my columns, Start and End, but can not get it working for bars with non-empty keys. What am I doing wrong
With G2antt1
	.BeginUpdate
	With .Columns
		.Add "Tasks"
		With .Add("Start")
			.Def(18) = 1
			.Def(19) = "A"
		End With
		With .Add("End")
			.Def(18) = 2
			.Def(19) = "A"
		End With
	End With
	.Items.AllowCellValueToItemBar = True
	With .Chart
		.PaneWidth(False) = 256
		.FirstVisibleDate = #1/1/2002#
		.LevelCount = 2
		.Bars.Item("Task").OverlaidType = 3
	End With
	With .Items
		.AddBar .AddItem("Task 1"),"Task",#1/4/2002#,#1/8/2002#,"A","A"
		h = .AddItem("Task 2")
		.AddBar h,"Task",#1/6/2002#,#1/10/2002#,"A","A"
		.AddBar h,"Task",#1/4/2002#,#1/8/2002#,"B","B"
		.ItemBar(h,"B",33) = 255
	End With
	.EndUpdate
End With
|
|
1454
|
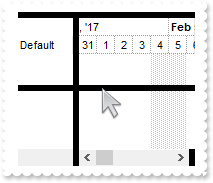
The right pane needs to show ONLY the hours 6am to 9pm (every hour) for one day only and the user should not to be able to scroll left or right nor see any other hours. How can I do that
With G2antt1
	.BeginUpdate
	.Columns.Add "Tasks"
	With .Chart
		.LevelCount = 2
		.ScrollRange(0) = #1/1/2001#
		.ScrollRange(1) = #1/1/2001#
		.UnitScale = 65536
		.NonworkingHours = 12582975
		.ShowNonworkingUnits = False
		.ShowNonworkingHours = False
		.Level(0).Alignment = 17 ' AlignmentEnum.exHOutside Or AlignmentEnum.CenterAlignment
		.UnitWidth = 18
		.PaneWidth(True) = 294
		.ScrollBar = False
	End With
	.OnResizeControl = 128
	.EndUpdate
End With
|
|
1453
|
Is it possible to count only a specified type of bars without enumerating them
With G2antt1
	.Columns.Add "Tasks"
	.Chart.FirstVisibleDate = #1/1/2001#
	With .Items
		.AddBar .AddItem("Task 1"),"Task",#1/2/2001#,#1/4/2001#,"K1","K1"
		.AddBar .AddItem("Task 2"),"Progress",#1/3/2001#,#1/5/2001#
		.AddBar .AddItem("Task 3"),"Task",#1/2/2001#,#1/4/2001#,"P3","P3"
		Debug.Print( "K*" )
		Debug.Print( .ItemBar(0,"<K*>",256) )
		Debug.Print( "K* P*" )
		Debug.Print( .ItemBar(0,"<K* P*>",256) )
	End With
End With
|
|
1452
|
How can I count or get the numbers of the bars in the chart
With G2antt1
	.Columns.Add "Tasks"
	.Chart.FirstVisibleDate = #1/1/2001#
	With .Items
		.AddBar .AddItem("Task 1"),"Task",#1/2/2001#,#1/4/2001#,"K1","K1"
		.AddBar .AddItem("Task 2"),"Task",#1/2/2001#,#1/4/2001#,"A2","A2"
		.AddBar .AddItem("Task 3"),"Task",#1/2/2001#,#1/4/2001#,"K3","K3"
		Debug.Print( "All" )
		Debug.Print( .ItemBar(0,"<*>",256) )
		Debug.Print( "A*" )
		Debug.Print( .ItemBar(0,"<A*>",256) )
		Debug.Print( "K*" )
		Debug.Print( .ItemBar(0,"<K*>",256) )
	End With
End With
|
|
1451
|
Is it possible to remove only specified bars from ALL items at once
With G2antt1
	.Columns.Add "Tasks"
	.Chart.FirstVisibleDate = #1/1/2001#
	With .Items
		.AddBar .AddItem("Task 1"),"Task",#1/2/2001#,#1/4/2001#,"K1","K1"
		.AddBar .AddItem("Task 2"),"Task",#1/2/2001#,#1/4/2001#,"A2","A2"
		.AddBar .AddItem("Task 3"),"Task",#1/2/2001#,#1/4/2001#,"K3","K3"
		.RemoveBar 0,"<K*>"
	End With
End With
|
|
1450
|
How can I remove all bars from the chart (method 2)
With G2antt1
	.Columns.Add "Tasks"
	.Chart.FirstVisibleDate = #1/1/2001#
	With .Items
		.AddBar .AddItem("Task 1"),"Task",#1/2/2001#,#1/4/2001#,"K1","K1"
		.AddBar .AddItem("Task 2"),"Task",#1/2/2001#,#1/4/2001#,"A2","A2"
		.AddBar .AddItem("Task 3"),"Task",#1/2/2001#,#1/4/2001#,"K3","K3"
		.ClearBars 0
	End With
End With
|
|
1449
|
How can I remove all bars from the chart (method 1)
With G2antt1
	.Columns.Add "Tasks"
	.Chart.FirstVisibleDate = #1/1/2001#
	With .Items
		.AddBar .AddItem("Task 1"),"Task",#1/2/2001#,#1/4/2001#,"K1","K1"
		.AddBar .AddItem("Task 2"),"Task",#1/2/2001#,#1/4/2001#,"A2","A2"
		.AddBar .AddItem("Task 3"),"Task",#1/2/2001#,#1/4/2001#,"K3","K3"
		.RemoveBar 0,"<*>"
	End With
End With
|
|
1448
|
Is it possible to update at once a property for several bars without enumerating them
With G2antt1
	.Columns.Add "Tasks"
	.Chart.FirstVisibleDate = #1/1/2001#
	With .Items
		.AddBar .AddItem("Task 1"),"Task",#1/2/2001#,#1/4/2001#,"K1","K1"
		.AddBar .AddItem("Task 2"),"Task",#1/2/2001#,#1/4/2001#,"A2","A2"
		.AddBar .AddItem("Task 3"),"Task",#1/2/2001#,#1/4/2001#,"K3","K3"
		.ItemBar(0,"<K*>",33) = 255
	End With
End With
|
|
1447
|
Is it possible to update at once a property of ALL bars without enumerating them
With G2antt1
	.Columns.Add "Tasks"
	.Chart.FirstVisibleDate = #1/1/2001#
	With .Items
		.AddBar .AddItem("Task 1"),"Task",#1/2/2001#,#1/4/2001#,"K1","K1"
		.AddBar .AddItem("Task 2"),"Task",#1/2/2001#,#1/4/2001#,"A2","A2"
		.AddBar .AddItem("Task 3"),"Task",#1/2/2001#,#1/4/2001#,"K3","K3"
		.ItemBar(0,"<*>",33) = 255
	End With
End With
|
|
1446
|
How do I prevent selecting a new item when selecting a bar
With G2antt1
	.BeginUpdate
	.Columns.Add "Task"
	With .Chart
		.FirstVisibleDate = #12/29/2000#
		.PaneWidth(False) = 64
		.LevelCount = 2
		.SelectOnClick = False
	End With
	With .Items
		.AddBar .AddItem("Task 1"),"Task",#1/2/2001#,#1/4/2001#,"K1"
		.AddBar .AddItem("Task 2"),"Task",#1/4/2001#,#1/6/2001#,"K2"
		.AddBar .AddItem("Task 3"),"Task",#1/8/2001#,#1/10/2001#,"K3"
		.SelectItem(.FirstVisibleItem) = True
	End With
	.EndUpdate
End With
|
|
1445
|
Is it possible to find out all incoming bars ( recursively )
' MouseMove event - Occurs when the user moves the mouse.
Private Sub G2antt1_MouseMove(ByVal Button As Integer, ByVal Shift As Integer, ByVal X As Long, ByVal Y As Long)
	With G2antt1
		b = .Chart.BarFromPoint(-1,-1)
		i = .ItemFromPoint(-1,-1,c,hit)
		Debug.Print( .Items.ItemBar(i,b,542) )
	End With
End Sub

With G2antt1
	.BeginUpdate
	.Columns.Add "Tasks"
	With .Chart
		.LevelCount = 2
		.FirstVisibleDate = #12/28/2000#
		.PaneWidth(False) = 96
		.NonworkingDays = 0
		.AllowLinkBars = True
		.AllowCreateBar = 1
	End With
	With .Items
		h1 = .AddItem("Task 1")
		.AddBar h1,"Task",#1/2/2001#,#1/4/2001#,"A","A"
		h2 = .AddItem("Task 2")
		.AddBar h2,"Task",#1/5/2001#,#1/7/2001#,"B","B"
		.AddLink "L1",h1,"A",h2,"B"
		h3 = .AddItem("Task 3")
		.AddBar h3,"Task",#1/8/2001#,#1/10/2001#,"C","C"
		.AddLink "L2",h2,"B",h3,"C"
		h4 = .AddItem("Task 4")
		.AddBar h4,"Task",#1/8/2001#,#1/10/2001#,"D","D"
		.AddLink "L3",h1,"A",h4,"D"
	End With
	.EndUpdate
End With
|
|
1444
|
How do I find the incoming bars
' MouseMove event - Occurs when the user moves the mouse.
Private Sub G2antt1_MouseMove(ByVal Button As Integer, ByVal Shift As Integer, ByVal X As Long, ByVal Y As Long)
	With G2antt1
		b = .Chart.BarFromPoint(-1,-1)
		i = .ItemFromPoint(-1,-1,c,hit)
		Debug.Print( .Items.ItemBar(i,b,541) )
	End With
End Sub

With G2antt1
	.BeginUpdate
	.Columns.Add "Tasks"
	With .Chart
		.LevelCount = 2
		.FirstVisibleDate = #12/28/2000#
		.PaneWidth(False) = 96
		.NonworkingDays = 0
		.AllowLinkBars = True
		.AllowCreateBar = 1
	End With
	With .Items
		h1 = .AddItem("Task 1")
		.AddBar h1,"Task",#1/2/2001#,#1/4/2001#,"A","A"
		h2 = .AddItem("Task 2")
		.AddBar h2,"Task",#1/5/2001#,#1/7/2001#,"B","B"
		.AddLink "L1",h1,"A",h2,"B"
		h3 = .AddItem("Task 3")
		.AddBar h3,"Task",#1/8/2001#,#1/10/2001#,"C","C"
		.AddLink "L2",h2,"B",h3,"C"
		h4 = .AddItem("Task 4")
		.AddBar h4,"Task",#1/8/2001#,#1/10/2001#,"D","D"
		.AddLink "L3",h1,"A",h4,"D"
	End With
	.EndUpdate
End With
|
|
1443
|
Is it possible to find out all incoming links ( recursively ). Incoming link is a link from another bar to the current bar
' MouseMove event - Occurs when the user moves the mouse.
Private Sub G2antt1_MouseMove(ByVal Button As Integer, ByVal Shift As Integer, ByVal X As Long, ByVal Y As Long)
	With G2antt1
		b = .Chart.BarFromPoint(-1,-1)
		i = .ItemFromPoint(-1,-1,c,hit)
		Debug.Print( .Items.ItemBar(i,b,536) )
	End With
End Sub

With G2antt1
	.BeginUpdate
	.Columns.Add "Tasks"
	With .Chart
		.LevelCount = 2
		.FirstVisibleDate = #12/28/2000#
		.PaneWidth(False) = 96
		.NonworkingDays = 0
		.AllowLinkBars = True
		.AllowCreateBar = 1
	End With
	With .Items
		h1 = .AddItem("Task 1")
		.AddBar h1,"Task",#1/2/2001#,#1/4/2001#,"A","A"
		h2 = .AddItem("Task 2")
		.AddBar h2,"Task",#1/5/2001#,#1/7/2001#,"B","B"
		.AddLink "L1",h1,"A",h2,"B"
		h3 = .AddItem("Task 3")
		.AddBar h3,"Task",#1/8/2001#,#1/10/2001#,"C","C"
		.AddLink "L2",h2,"B",h3,"C"
		h4 = .AddItem("Task 4")
		.AddBar h4,"Task",#1/8/2001#,#1/10/2001#,"D","D"
		.AddLink "L3",h1,"A",h4,"D"
	End With
	.EndUpdate
End With
|
|
1442
|
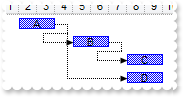
How do I find the incoming links. Incoming link is link from another bar to the current bar
' MouseMove event - Occurs when the user moves the mouse.
Private Sub G2antt1_MouseMove(ByVal Button As Integer, ByVal Shift As Integer, ByVal X As Long, ByVal Y As Long)
	With G2antt1
		b = .Chart.BarFromPoint(-1,-1)
		i = .ItemFromPoint(-1,-1,c,hit)
		Debug.Print( .Items.ItemBar(i,b,534) )
	End With
End Sub

With G2antt1
	.BeginUpdate
	.Columns.Add "Tasks"
	With .Chart
		.LevelCount = 2
		.FirstVisibleDate = #12/28/2000#
		.PaneWidth(False) = 96
		.NonworkingDays = 0
		.AllowLinkBars = True
		.AllowCreateBar = 1
	End With
	With .Items
		h1 = .AddItem("Task 1")
		.AddBar h1,"Task",#1/2/2001#,#1/4/2001#,"A","A"
		h2 = .AddItem("Task 2")
		.AddBar h2,"Task",#1/5/2001#,#1/7/2001#,"B","B"
		.AddLink "L1",h1,"A",h2,"B"
		h3 = .AddItem("Task 3")
		.AddBar h3,"Task",#1/8/2001#,#1/10/2001#,"C","C"
		.AddLink "L2",h2,"B",h3,"C"
		h4 = .AddItem("Task 4")
		.AddBar h4,"Task",#1/8/2001#,#1/10/2001#,"D","D"
		.AddLink "L3",h1,"A",h4,"D"
	End With
	.EndUpdate
End With
|
|
1441
|
Is it possible to find out all outgoing bars ( recursively )
' MouseMove event - Occurs when the user moves the mouse.
Private Sub G2antt1_MouseMove(ByVal Button As Integer, ByVal Shift As Integer, ByVal X As Long, ByVal Y As Long)
	With G2antt1
		b = .Chart.BarFromPoint(-1,-1)
		i = .ItemFromPoint(-1,-1,c,hit)
		Debug.Print( .Items.ItemBar(i,b,532) )
	End With
End Sub

With G2antt1
	.BeginUpdate
	.Columns.Add "Tasks"
	With .Chart
		.LevelCount = 2
		.FirstVisibleDate = #12/28/2000#
		.PaneWidth(False) = 96
		.NonworkingDays = 0
		.AllowLinkBars = True
		.AllowCreateBar = 1
	End With
	With .Items
		h1 = .AddItem("Task 1")
		.AddBar h1,"Task",#1/2/2001#,#1/4/2001#,"A","A"
		h2 = .AddItem("Task 2")
		.AddBar h2,"Task",#1/5/2001#,#1/7/2001#,"B","B"
		.AddLink "L1",h1,"A",h2,"B"
		h3 = .AddItem("Task 3")
		.AddBar h3,"Task",#1/8/2001#,#1/10/2001#,"C","C"
		.AddLink "L2",h2,"B",h3,"C"
		h4 = .AddItem("Task 4")
		.AddBar h4,"Task",#1/8/2001#,#1/10/2001#,"D","D"
		.AddLink "L3",h1,"A",h4,"D"
	End With
	.EndUpdate
End With
|
|
1440
|
How do I find the outgoing bars
' MouseMove event - Occurs when the user moves the mouse.
Private Sub G2antt1_MouseMove(ByVal Button As Integer, ByVal Shift As Integer, ByVal X As Long, ByVal Y As Long)
	With G2antt1
		b = .Chart.BarFromPoint(-1,-1)
		i = .ItemFromPoint(-1,-1,c,hit)
		Debug.Print( .Items.ItemBar(i,b,531) )
	End With
End Sub

With G2antt1
	.BeginUpdate
	.Columns.Add "Tasks"
	With .Chart
		.LevelCount = 2
		.FirstVisibleDate = #12/28/2000#
		.PaneWidth(False) = 96
		.NonworkingDays = 0
		.AllowLinkBars = True
		.AllowCreateBar = 1
	End With
	With .Items
		h1 = .AddItem("Task 1")
		.AddBar h1,"Task",#1/2/2001#,#1/4/2001#,"A","A"
		h2 = .AddItem("Task 2")
		.AddBar h2,"Task",#1/5/2001#,#1/7/2001#,"B","B"
		.AddLink "L1",h1,"A",h2,"B"
		h3 = .AddItem("Task 3")
		.AddBar h3,"Task",#1/8/2001#,#1/10/2001#,"C","C"
		.AddLink "L2",h2,"B",h3,"C"
		h4 = .AddItem("Task 4")
		.AddBar h4,"Task",#1/8/2001#,#1/10/2001#,"D","D"
		.AddLink "L3",h1,"A",h4,"D"
	End With
	.EndUpdate
End With
|
|
1439
|
Is it possible to find out all outgoing links ( recursively ). Outgoing link is link from a bar to another bar
' MouseMove event - Occurs when the user moves the mouse.
Private Sub G2antt1_MouseMove(ByVal Button As Integer, ByVal Shift As Integer, ByVal X As Long, ByVal Y As Long)
	With G2antt1
		b = .Chart.BarFromPoint(-1,-1)
		i = .ItemFromPoint(-1,-1,c,hit)
		Debug.Print( .Items.ItemBar(i,b,526) )
	End With
End Sub

With G2antt1
	.BeginUpdate
	.Columns.Add "Tasks"
	With .Chart
		.LevelCount = 2
		.FirstVisibleDate = #12/28/2000#
		.PaneWidth(False) = 96
		.NonworkingDays = 0
		.AllowLinkBars = True
		.AllowCreateBar = 1
	End With
	With .Items
		h1 = .AddItem("Task 1")
		.AddBar h1,"Task",#1/2/2001#,#1/4/2001#,"A","A"
		h2 = .AddItem("Task 2")
		.AddBar h2,"Task",#1/5/2001#,#1/7/2001#,"B","B"
		.AddLink "L1",h1,"A",h2,"B"
		h3 = .AddItem("Task 3")
		.AddBar h3,"Task",#1/8/2001#,#1/10/2001#,"C","C"
		.AddLink "L2",h2,"B",h3,"C"
		h4 = .AddItem("Task 4")
		.AddBar h4,"Task",#1/8/2001#,#1/10/2001#,"D","D"
		.AddLink "L3",h1,"A",h4,"D"
	End With
	.EndUpdate
End With
|
|
1438
|
How do I find the outgoing links. Outgoing link is link from a bar to another bar
' MouseMove event - Occurs when the user moves the mouse.
Private Sub G2antt1_MouseMove(ByVal Button As Integer, ByVal Shift As Integer, ByVal X As Long, ByVal Y As Long)
	With G2antt1
		b = .Chart.BarFromPoint(-1,-1)
		i = .ItemFromPoint(-1,-1,c,hit)
		Debug.Print( .Items.ItemBar(i,b,524) )
	End With
End Sub

With G2antt1
	.BeginUpdate
	.Columns.Add "Tasks"
	With .Chart
		.LevelCount = 2
		.FirstVisibleDate = #12/28/2000#
		.PaneWidth(False) = 96
		.NonworkingDays = 0
		.AllowLinkBars = True
		.AllowCreateBar = 1
	End With
	With .Items
		h1 = .AddItem("Task 1")
		.AddBar h1,"Task",#1/2/2001#,#1/4/2001#,"A","A"
		h2 = .AddItem("Task 2")
		.AddBar h2,"Task",#1/5/2001#,#1/7/2001#,"B","B"
		.AddLink "L1",h1,"A",h2,"B"
		h3 = .AddItem("Task 3")
		.AddBar h3,"Task",#1/8/2001#,#1/10/2001#,"C","C"
		.AddLink "L2",h2,"B",h3,"C"
		h4 = .AddItem("Task 4")
		.AddBar h4,"Task",#1/8/2001#,#1/10/2001#,"D","D"
		.AddLink "L3",h1,"A",h4,"D"
	End With
	.EndUpdate
End With
|
|
1437
|
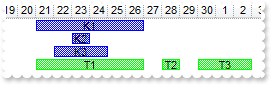
How do I select a bar using the right-click
' MouseDown event - Occurs when the user presses a mouse button.
Private Sub G2antt1_MouseDown(ByVal Button As Integer, ByVal Shift As Integer, ByVal X As Long, ByVal Y As Long)
	With G2antt1
		With .Items
			.ItemBar(0,"<*>",257) = False
			.ItemBar(G2antt1.ItemFromPoint(-1,-1,c,hit),G2antt1.Chart.BarFromPoint(-1,-1),257) = True
		End With
	End With
End Sub

With G2antt1
	.BeginUpdate
	.Columns.Add "Task"
	With .Chart
		.FirstVisibleDate = #12/29/2000#
		.PaneWidth(False) = 64
		.LevelCount = 2
	End With
	With .Items
		.AddBar .AddItem("Task 1"),"Task",#1/2/2001#,#1/4/2001#,"K1"
		.AddBar .AddItem("Task 2"),"Task",#1/4/2001#,#1/6/2001#,"K2"
		.AddBar .AddItem("Task 3"),"Task",#1/8/2001#,#1/10/2001#,"K3"
	End With
	.EndUpdate
End With
|
|
1436
|
How can I add or change the padding (spaces) for captions in the control's header
With G2antt1
	.BeginUpdate
	.Columns.Add("Padding-Left").Def(52) = 18
	With .Columns.Add("Padding-Right")
		.Def(53) = 18
		.HeaderAlignment = 2
	End With
	.EndUpdate
End With
|
|
1435
|
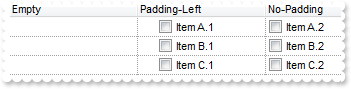
Do you have any plans to add cell spacing and cell padding to the cells
With G2antt1
	.BeginUpdate
	.DrawGridLines = -2
	With .Columns.Add("Padding-Left")
		.Def(0) = True
		.Def(48) = 18
	End With
	.Columns.Add("No-Padding").Def(0) = True
	.Columns.Add("Empty").Position = 0
	With .Items
		.CellValue(.AddItem("Item A.1"),1) = "Item A.2"
		.CellValue(.AddItem("Item B.1"),1) = "Item B.2"
		.CellValue(.AddItem("Item C.1"),1) = "Item C.2"
	End With
	.EndUpdate
End With
|
|
1434
|
Can I display somehow the filter just on the top of the list, with an editor associated to each column
' AddItem event - Occurs after a new Item has been inserted to Items collection.
Private Sub G2antt1_AddItem(ByVal Item As Long)
	With G2antt1
		With .Items
			.AddBar Item,"Task",.CellValue(Item,2),.CellValue(Item,4)
		End With
	End With
End Sub

' Change event - Occurs when the user changes the cell's content.
Private Sub G2antt1_Change(ByVal Item As Long, ByVal ColIndex As Long, NewValue As Variant)
	With G2antt1
		Debug.Print( "Locked:" )
		Debug.Print( .Items.IsItemLocked(Item) )
		With .Columns.Item(ColIndex)
			.Filter = NewValue
			.FilterType = 3
		End With
		.ApplyFilter
	End With
End Sub

' MouseUp event - Occurs when the user releases a mouse button.
Private Sub G2antt1_MouseUp(ByVal Button As Integer, ByVal Shift As Integer, ByVal X As Long, ByVal Y As Long)
	With G2antt1
		.Edit .Items.LockedItem(0,0)
	End With
End Sub

With G2antt1
	.ColumnAutoResize = False
	.ScrollBySingleLine = True
	.ContinueColumnScroll = False
	.Chart.FirstVisibleDate = #8/3/1994#
	Set rs = CreateObject("ADOR.Recordset")
	With rs
		.Open "Orders","Provider=Microsoft.ACE.OLEDB.12.0;Data Source=C:\Program Files\Exontrol\ExG2antt\Sample\Access\misc.accdb",3,3
	End With
	.DataSource = rs
	With .Items
		.LockedItemCount(0) = 2
		h = .LockedItem(0,0)
		.CellEditor(h,0).EditType = 1
		h = .LockedItem(0,1)
		.ItemHeight(h) = 4
		.ItemDivider(h) = 0
		.SelectableItem(h) = False
	End With
End With
|
|
1433
|
Is it possible to display information about the firing events
' Event event - Notifies the application once the control fires an event.
Private Sub G2antt1_Event(ByVal EventID As Long)
	With G2antt1
		Debug.Print( .EventParam(-2) )
	End With
End Sub
|
|
1432
|
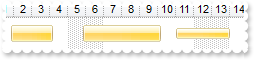
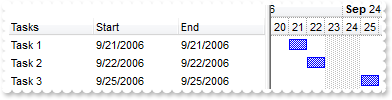
I need to specify the start and end dates of the bar to be the same, but to keep count of the working units. Is it possible
With G2antt1
	.BeginUpdate
	.MarkSearchColumn = False
	With .Columns
		.Add "Tasks"
		.Add("Start").Def(18) = 1
		.Add("End").Def(18) = 543
	End With
	With .Chart
		.FirstVisibleDate = #9/20/2006#
		.LevelCount = 2
		.PaneWidth(0) = 256
		.ShowEmptyBars = 1
		.Bars.Add("Task:Split").Shortcut = "Task"
	End With
	With .Items
		.AllowCellValueToItemBar = True
		.AddBar .AddItem("Task 1"),"Task",#9/21/2006#,#9/21/2006#
		.AddBar .AddItem("Task 2"),"Task",#9/22/2006#,#9/25/2006#
		.AddBar .AddItem("Task 3"),"Task",#9/25/2006#,#9/25/2006#
		.ItemBar(0,"<*>",20) = True
	End With
	.EndUpdate
End With
|
|
1431
|
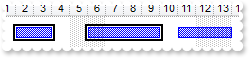
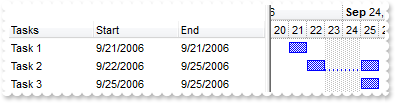
I need to specify the start and end dates of the bar to be the same, but no bars are shown. (NOT recommended for bars with exBarKeepWorkingCount ) What I can do
With G2antt1
	.BeginUpdate
	.MarkSearchColumn = False
	With .Columns
		.Add "Tasks"
		.Add("Start").Def(18) = 1
		.Add("End").Def(18) = 543
	End With
	With .Chart
		.FirstVisibleDate = #9/20/2006#
		.LevelCount = 2
		.PaneWidth(0) = 256
		.ShowEmptyBars = 1
	End With
	With .Items
		.AllowCellValueToItemBar = True
		.AddBar .AddItem("Task 1"),"Task",#9/21/2006#,#9/21/2006#
		.AddBar .AddItem("Task 2"),"Task",#9/22/2006#,#9/22/2006#
		.AddBar .AddItem("Task 3"),"Task",#9/25/2006#,#9/25/2006#
	End With
	.EndUpdate
End With
|
|
1430
|
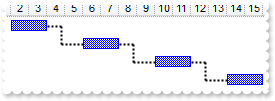
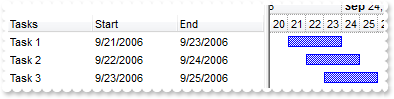
I need my chart to display the end date with on day less. How can I do this (Method 2)
With G2antt1
	.BeginUpdate
	.MarkSearchColumn = False
	With .Columns
		.Add "Tasks"
		With .Add("Start")
			.Def(18) = 1
			.Editor.EditType = 7
		End With
		With .Add("End")
			.Def(18) = 543
			.Editor.EditType = 7
		End With
	End With
	With .Chart
		.FirstVisibleDate = #9/20/2006#
		.LevelCount = 2
		.PaneWidth(0) = 256
		.NonworkingDays = 0
	End With
	With .Items
		.AllowCellValueToItemBar = True
		.AddBar .AddItem("Task 1"),"Task",#9/21/2006#,#9/24/2006#
		.AddBar .AddItem("Task 2"),"Task",#9/22/2006#,#9/25/2006#
		.AddBar .AddItem("Task 3"),"Task",#9/23/2006#,#9/26/2006#
	End With
	.EndUpdate
End With
|
|
1429
|
Is it possible to change the width of a specified time unit
With G2antt1
	.BeginUpdate
	With .Chart
		.PaneWidth(False) = 0
		.LevelCount = 2
		.FirstVisibleDate = #1/1/2008#
		.AllowInsideZoom = True
		.AllowResizeInsideZoom = False
		.InsideZoomOnDblClick = False
		.DefaultInsideZoomFormat.BackColorChart = RGB(255,0,255)
		With .InsideZooms
			.SplitBaseLevel = False
			.DefaultWidth = 18
			With .Add(#1/15/2008#)
				.AllowInsideFormat = False
				.Width = 128
			End With
		End With
	End With
	.EndUpdate
End With
|
|
1428
|
The level unit of the chart is set to day, so i'd like to set the whole background of the current day. Is it possible to set a background color only on the current day (Method 2)
With G2antt1
	.BeginUpdate
	With .Chart
		.PaneWidth(False) = 0
		.LevelCount = 2
		.FirstVisibleDate = #1/1/2008#
		.AllowInsideZoom = True
		.AllowResizeInsideZoom = False
		.InsideZoomOnDblClick = False
		.DefaultInsideZoomFormat.BackColorChart = RGB(255,0,0)
		With .InsideZooms
			.SplitBaseLevel = False
			.DefaultWidth = 18
			.Add(#1/15/2008#).AllowInsideFormat = False
		End With
	End With
	.EndUpdate
End With
|
|
1427
|
The level unit of the chart is set to day, so i'd like to set the whole background of the current day. Is it possible to set a background color only on the current day (Method 1)
With G2antt1
	.BeginUpdate
	With .Chart
		.PaneWidth(False) = 0
		.FirstVisibleDate = #1/1/2008#
		.MarkTodayColor = .BackColor
		.LevelCount = 2
		.MarkSelectDateColor = &H7fff0000
		.SelectLevel = 1
		.SelectDate(#1/15/2008#) = True
	End With
	.EndUpdate
End With
|
|
1426
|
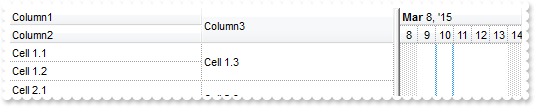
How can I change the layout of my columns when using the exCRD
With G2antt1
	.BeginUpdate
	.DrawGridLines = -2
	.DefaultItemHeight = 36
	With .Columns
		With .Add("Column1")
			.Visible = False
			.Editor.EditType = 1
		End With
		With .Add("Column2")
			.Visible = False
			.Editor.EditType = 1
		End With
		.Add("Column3").Visible = False
		With .Add("FormatLevel")
			.FormatLevel = "(0/1),2"
			.Def(32) = .FormatLevel
		End With
	End With
	With .Items
		h = .AddItem("Cell 1.1")
		.CellValue(h,1) = "Cell 1.2"
		.CellValue(h,2) = "Cell 1.3"
		h = .AddItem("Cell 2.1")
		.CellValue(h,1) = "Cell 2.2"
		.CellValue(h,2) = "Cell 2.3"
	End With
	.EndUpdate
End With
|
|
1425
|
How can I overlaid a single bar
With G2antt1
	.BeginUpdate
	.DefaultItemHeight = 22
	.Columns.Add "Task"
	.ScrollBySingleLine = True
	.BackColorAlternate = RGB(240,240,240)
	With .Chart
		.AllowCreateBar = 1
		.PaneWidth(False) = 48
		.FirstVisibleDate = #12/28/2000#
		.LevelCount = 2
		With .Bars.Item("Task")
			.OverlaidGroup = "OTask"
			.OverlaidType = 0
			.Def(3) = "<%=%9%>"
		End With
		With .Bars.Copy("Task","OTask")
			.OverlaidGroup = "Task"
			.OverlaidType = 8196 ' OverlaidBarsTypeEnum.exOverlaidBarsStrict Or OverlaidBarsTypeEnum.exOverlaidBarsCascade
		End With
	End With
	With .Items
		h1 = .AddItem("Default")
		h = .AddItem("Overlaid")
		.AddBar h,"Task",#1/2/2001#,#1/4/2001#,"A1"
		.AddBar h,"Task",#1/4/2001#,#1/7/2001#,"A3"
		.AddBar h,"OTask",#1/3/2001#,#1/5/2001#,"A2"
		.ItemBar(h,"A2",33) = 255
		.AddBar h,"Task",#1/5/2001#,#1/8/2001#,"A4"
		h1 = .AddItem("Default")
	End With
	.EndUpdate
End With
|
|
1424
|
How can I use the exOverlaidBarsCascade, exBarOverlaidKey
' CreateBar event - Fired when the user creates a new bar.
Private Sub G2antt1_CreateBar(ByVal Item As Long, ByVal DateStart As Date, ByVal DateEnd As Date)
	With G2antt1
		.Items.ItemBar(Item,"newbar",52) = "Level0"
	End With
End Sub

With G2antt1
	.BeginUpdate
	.DefaultItemHeight = 22
	.Columns.Add "Task"
	.ScrollBySingleLine = True
	.BackColorAlternate = RGB(240,240,240)
	With .Chart
		.AllowCreateBar = 1
		.PaneWidth(False) = 48
		.FirstVisibleDate = #12/28/2000#
		.LevelCount = 2
		With .Bars.Item("Task")
			.OverlaidType = 4
			.Def(3) = "<%=%9%>"
		End With
	End With
	With .Items
		h1 = .AddItem("Default")
		h = .AddItem("Overlaid")
		.AddBar h,"Task",#1/2/2001#,#1/4/2001#,"A1"
		.ItemBar(h,"A1",52) = "Level0"
		.AddBar h,"Task",#1/4/2001#,#1/7/2001#,"A3"
		.ItemBar(h,"A3",52) = "Level0"
		.AddBar h,"Task",#1/3/2001#,#1/5/2001#,"A2"
		.ItemBar(h,"A2",33) = 255
		.ItemBar(h,"A2",52) = "Level1"
		.AddBar h,"Task",#1/5/2001#,#1/8/2001#,"A4"
		.ItemBar(h,"A4",33) = 255
		.ItemBar(h,"A4",52) = "Level1"
		h1 = .AddItem("Default")
	End With
	.EndUpdate
End With
|
|
1423
|
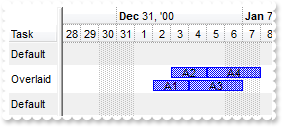
How can I use the exOverlaidBarsStack+exOverlaidBarsStackAutoArrange
With G2antt1
	.BeginUpdate
	.DefaultItemHeight = 22
	.Columns.Add "Task"
	.ScrollBySingleLine = True
	.BackColorAlternate = RGB(240,240,240)
	With .Chart
		.PaneWidth(False) = 48
		.FirstVisibleDate = #12/28/2000#
		.LevelCount = 2
		With .Bars.Item("Task")
			.OverlaidType = 515 ' OverlaidBarsTypeEnum.exOverlaidBarsStackAutoArrange Or OverlaidBarsTypeEnum.exOverlaidBarsStack
			.Def(3) = "<%=%9%>"
		End With
	End With
	With .Items
		h1 = .AddItem("Default")
		h = .AddItem("Overlaid")
		.AddBar h,"Task",#1/2/2001#,#1/4/2001#,"A1"
		.AddBar h,"Task",#1/3/2001#,#1/5/2001#,"A2"
		.AddBar h,"Task",#1/4/2001#,#1/7/2001#,"A3"
		.AddBar h,"Task",#1/5/2001#,#1/8/2001#,"A4"
		h1 = .AddItem("Default")
	End With
	.EndUpdate
End With
|
|
1422
|
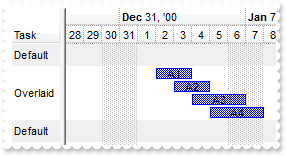
How can I use the exOverlaidBarsStack
With G2antt1
	.BeginUpdate
	.DefaultItemHeight = 22
	.Columns.Add "Task"
	.ScrollBySingleLine = True
	.BackColorAlternate = RGB(240,240,240)
	With .Chart
		.PaneWidth(False) = 48
		.FirstVisibleDate = #12/28/2000#
		.LevelCount = 2
		With .Bars.Item("Task")
			.OverlaidType = 3
			.Def(3) = "<%=%9%>"
		End With
	End With
	With .Items
		h1 = .AddItem("Default")
		h = .AddItem("Overlaid")
		.AddBar h,"Task",#1/2/2001#,#1/4/2001#,"A1"
		.AddBar h,"Task",#1/3/2001#,#1/5/2001#,"A2"
		.AddBar h,"Task",#1/4/2001#,#1/7/2001#,"A3"
		.AddBar h,"Task",#1/5/2001#,#1/8/2001#,"A4"
		h1 = .AddItem("Default")
	End With
	.EndUpdate
End With
|
|
1421
|
How can I use the exOverlaidBarsIntersect
With G2antt1
	.BeginUpdate
	.DefaultItemHeight = 22
	.Columns.Add "Task"
	.ScrollBySingleLine = True
	.BackColorAlternate = RGB(240,240,240)
	With .Chart
		.PaneWidth(False) = 48
		.FirstVisibleDate = #12/28/2000#
		.LevelCount = 2
		With .Bars.Item("Task")
			.OverlaidType = 2
			.Overlaid(2) = "Progress"
			.Def(3) = "<%=%9%>"
		End With
	End With
	With .Items
		h1 = .AddItem("Default")
		h = .AddItem("Overlaid")
		.AddBar h,"Task",#1/2/2001#,#1/4/2001#,"A1"
		.AddBar h,"Task",#1/3/2001#,#1/5/2001#,"A2"
		.AddBar h,"Task",#1/4/2001#,#1/7/2001#,"A3"
		.AddBar h,"Task",#1/5/2001#,#1/8/2001#,"A4"
		h1 = .AddItem("Default")
	End With
	.EndUpdate
End With
|
|
1420
|
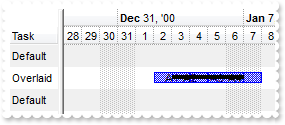
How can I use the exOverlaidBarsOffset
With G2antt1
	.BeginUpdate
	.DefaultItemHeight = 22
	.Columns.Add "Task"
	.ScrollBySingleLine = True
	.BackColorAlternate = RGB(240,240,240)
	With .Chart
		.PaneWidth(False) = 48
		.FirstVisibleDate = #12/28/2000#
		.LevelCount = 2
		With .Bars.Item("Task")
			.OverlaidType = 1
			.Def(3) = "<%=%9%>"
		End With
	End With
	With .Items
		h1 = .AddItem("Default")
		h = .AddItem("Overlaid")
		.AddBar h,"Task",#1/2/2001#,#1/4/2001#,"A1"
		.AddBar h,"Task",#1/3/2001#,#1/5/2001#,"A2"
		.AddBar h,"Task",#1/4/2001#,#1/7/2001#,"A3"
		.AddBar h,"Task",#1/5/2001#,#1/8/2001#,"A4"
		h1 = .AddItem("Default")
	End With
	.EndUpdate
End With
|
|
1419
|
Is it possible to specify the end of the project when using the SchedulePDM method
With G2antt1
	.BeginUpdate
	.Columns.Add "Task"
	With .Chart
		.FirstVisibleDate = #12/28/2000#
		.PaneWidth(False) = 48
		.LevelCount = 2
	End With
	With .Items
		h1 = .AddItem("Task 1")
		.AddBar h1,"Task",#1/2/2001#,#1/4/2001#,"K1"
		h2 = .AddItem("Task 2")
		.AddBar h2,"Task",#1/2/2001#,#1/5/2001#,"K2"
		.AddLink "L1",h1,"K1",h2,"K2"
		.Link("L1",12) = "FS"
		h3 = .AddItem("Task 3")
		.AddBar h3,"Task",#1/2/2001#,#1/6/2001#,"K3"
		.AddLink "L2",h2,"K2",h3,"K3"
		.Link("L2",12) = "SS"
		.Link("L2",6) = 0
		.Link("L2",7) = 0
		.DefSchedulePDM(0) = 2
		.DefSchedulePDM(1) = #1/8/2001#
		.SchedulePDM 0,"K1"
	End With
	.EndUpdate
End With
|
|
1418
|
Is it possible to specify the start of the project when using the SchedulePDM method
With G2antt1
	.BeginUpdate
	.Columns.Add "Task"
	With .Chart
		.FirstVisibleDate = #12/28/2000#
		.PaneWidth(False) = 48
		.LevelCount = 2
	End With
	With .Items
		h1 = .AddItem("Task 1")
		.AddBar h1,"Task",#1/2/2001#,#1/4/2001#,"K1"
		h2 = .AddItem("Task 2")
		.AddBar h2,"Task",#1/2/2001#,#1/5/2001#,"K2"
		.AddLink "L1",h1,"K1",h2,"K2"
		.Link("L1",12) = "FS"
		h3 = .AddItem("Task 3")
		.AddBar h3,"Task",#1/2/2001#,#1/6/2001#,"K3"
		.AddLink "L2",h2,"K2",h3,"K3"
		.Link("L2",12) = "SS"
		.Link("L2",6) = 0
		.Link("L2",7) = 0
		.DefSchedulePDM(0) = 1
		.DefSchedulePDM(1) = #1/8/2001#
		.SchedulePDM 0,"K1"
	End With
	.EndUpdate
End With
|
|
1417
|
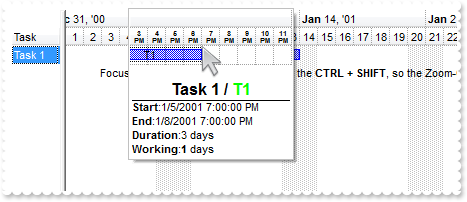
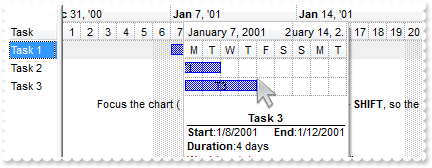
How can I change the caption or the addition information being displayed in the Zoom-OnFly view
With G2antt1
	.BeginUpdate
	.Columns.Add "Task"
	With .Chart
		.PaneWidth(False) = 48
		.FirstVisibleDate = #1/1/2001#
		.LevelCount = 2
		.AllowZoomOnFly = 24
		.ResizeUnitScale = 65536
		.Label(65536) = "<font ;5><b><%h%><br><%AM/PM%></b></font>"
		.ZoomOnFlyCaption = "<br><c><b><font ;12><%=%C0 + ' / <fgcolor=00FF00>' + %3%></font></fgcolor></b><br><solidline><upline><b>Start</b>:<%=%1%><br><b" & _
	">End</b>:<%=%2%><br><b>Duration</b>:<%=round(%2-%1) + ' days'%><br><b>Working</b>:<%='<b>' + int(%258) + '</b> days' + (0:=(%258" & _
	" - int(%258)) ? (' <fgcolor=FF0000><b>' + round(24 * =:0) + '</b> hours') : '') %>"
	End With
	With .Items
		h = .AddItem("Task 1")
		.AddBar h,"Task",#1/7/2001#,#1/10/2001#,"T1","T1"
		.AddBar h,"Task",#1/11/2001#,#1/14/2001#,"T3","T3"
		h = .AddItem()
		.AddBar h,"",#1/15/2001#,#1/15/2001#,"","Focus the chart ( click here ), and press the <b>CTRL + SHIFT</b>, so the Zoom-OnFly is shown."
		.SelectableItem(h) = False
	End With
	.EndUpdate
End With
|
|
1416
|
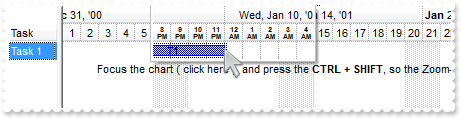
How can I change the scale in the Zoom-OnFly view
With G2antt1
	.BeginUpdate
	.Columns.Add "Task"
	With .Chart
		.PaneWidth(False) = 48
		.FirstVisibleDate = #1/1/2001#
		.LevelCount = 2
		.AllowZoomOnFly = 24
		.ResizeUnitScale = 65536
		.Label(65536) = "<font ;5><b><%h%><br><%AM/PM%></b></font>"
		.ZoomOnFlyCaption = ""
	End With
	With .Items
		h = .AddItem("Task 1")
		.AddBar h,"Task",#1/7/2001#,#1/10/2001#,"T1","T1"
		.AddBar h,"Task",#1/11/2001#,#1/14/2001#,"T3","T3"
		h = .AddItem()
		.AddBar h,"",#1/15/2001#,#1/15/2001#,"","Focus the chart ( click here ), and press the <b>CTRL + SHIFT</b>, so the Zoom-OnFly is shown."
		.SelectableItem(h) = False
	End With
	.EndUpdate
End With
|
|
1415
|
Is it possible to change the Zoom-OnFly view's background color
With G2antt1
	.BeginUpdate
	.Columns.Add "Task"
	With .Chart
		.PaneWidth(False) = 48
		.FirstVisibleDate = #1/1/2001#
		.LevelCount = 2
		.AllowZoomOnFly = 24
		.BackColorZoomOnFly = RGB(240,240,240)
	End With
	With .Items
		h = .AddItem("Task 1")
		.AddBar h,"Task",#1/7/2001#,#1/10/2001#,"T1","T1"
		.AddBar h,"Task",#1/11/2001#,#1/14/2001#,"T3","T3"
		h = .AddItem()
		.AddBar h,"",#1/15/2001#,#1/15/2001#,"","Focus the chart ( click here ), and press the <b>CTRL + SHIFT</b>, so the Zoom-OnFly is shown."
		.SelectableItem(h) = False
	End With
	.EndUpdate
End With
|
|
1414
|
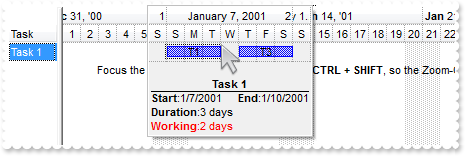
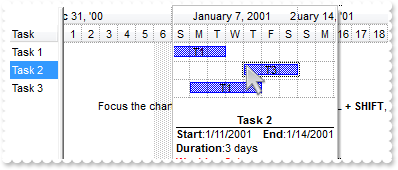
How can I include the selected items in the Zoom-OnFly view
With G2antt1
.BeginUpdate
.Columns.Add "Task"
With .Chart
.PaneWidth(False) = 48
.FirstVisibleDate = #1/1/2001#
.LevelCount = 2
.AllowZoomOnFly = 792 ' ZoomOnFlyEnum.exZoomOnFlyIncludeSelectedItems Or ZoomOnFlyEnum.exZoomOnFly
.SelBackColor = RGB(240,240,240)
.SelectOnClick = False
End With
With .Items
h = .AddItem("Task 1")
.AddBar h,"Task",#1/7/2001#,#1/10/2001#,"T1","T1"
.SelectItem(h) = True
h = .AddItem("Task 2")
.AddBar h,"Task",#1/11/2001#,#1/14/2001#,"T2","T2"
h = .AddItem("Task 3")
.AddBar h,"Task",#1/8/2001#,#1/12/2001#,"T3","T3"
h = .AddItem()
.AddBar h,"",#1/15/2001#,#1/15/2001#,"","Focus the chart ( click here ), and press the <b>CTRL + SHIFT</b>, so the Zoom-OnFly is shown."
.SelectableItem(h) = False
End With
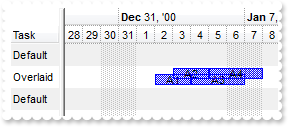
.EndUpdate
End With
|
|
1413
|
Is it possible to include the neighbors items in the Zoom-OnFly view
With G2antt1
	.BeginUpdate
	.Columns.Add "Task"
	With .Chart
		.PaneWidth(False) = 48
		.FirstVisibleDate = #1/1/2001#
		.LevelCount = 2
		.AllowZoomOnFly = 280 ' ZoomOnFlyEnum.exZoomOnFlyIncludeNeighborItems Or ZoomOnFlyEnum.exZoomOnFly
	End With
	With .Items
		h = .AddItem("Task 1")
		.AddBar h,"Task",#1/7/2001#,#1/10/2001#,"T1","T1"
		h = .AddItem("Task 2")
		.AddBar h,"Task",#1/11/2001#,#1/14/2001#,"T3","T3"
		h = .AddItem("Task 3")
		.AddBar h,"Task",#1/8/2001#,#1/12/2001#,"T1","T1"
		h = .AddItem()
		.AddBar h,"",#1/15/2001#,#1/15/2001#,"","Focus the chart ( click here ), and press the <b>CTRL + SHIFT</b>, so the Zoom-OnFly is shown."
		.SelectableItem(h) = False
	End With
	.EndUpdate
End With
|
|
1412
|
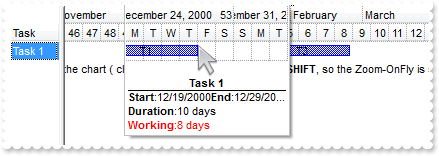
How can I enable the Zoom-OnFly view
With G2antt1
	.BeginUpdate
	.Columns.Add "Task"
	With .Chart
		.PaneWidth(False) = 48
		.FirstVisibleDate = #11/5/2000#
		.LevelCount = 2
		.UnitScale = 256
		.ResizeUnitScale = 4096
		.AllowZoomOnFly = 24
		.Bars.Item("Task").OverlaidType = 3
	End With
	With .Items
		h = .AddItem("Task 1")
		.AddBar h,"Task",#1/7/2001#,#1/17/2001#,"T1","T1"
		.AddBar h,"Task",#1/18/2001#,#2/24/2001#,"T3","T3"
		h = .AddItem()
		.AddBar h,"",#1/15/2001#,#1/15/2001#,"","Focus the chart ( click here ), and press the <b>CTRL + SHIFT</b>, so the Zoom-OnFly is shown."
		.SelectableItem(h) = False
	End With
	.EndUpdate
End With
|
|
1411
|
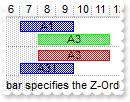
I am using the overlay bars on stack, can I somehow tell a type of bar, or a specific bar, to be always on top of all other�s. Like a Z-Index or something
With G2antt1
	.BeginUpdate
	.ScrollBySingleLine = True
	.Columns.Add "Task"
	.DrawGridLines = 1
	With .Chart
		.DrawGridLines = 1
		.AllowCreateBar = 1
		.AllowLinkBars = False
		.ResizeUnitScale = 65536
		.PaneWidth(False) = 48
		.FirstVisibleDate = #1/1/2001#
		.Bars.Item("Task").OverlaidType = 3
	End With
	With .Items
		h = .AddItem("Task 1")
		.AddBar h,"Task",#1/7/2001#,#1/10/2001#,"A1","A1"
		.AddBar h,"Task",#1/8/2001#,#1/12/2001#,"A3","A3"
		.ItemBar(h,"A3",33) = 65280
		h = .AddItem("Task 2")
		.AddBar h,"Task",#1/7/2001#,#1/10/2001#,"A31","A31"
		.AddBar h,"Task",#1/8/2001#,#1/12/2001#,"A3","A3"
		.ItemBar(h,"A3",33) = 255
		.AddBar .AddItem(),"",#1/10/2001#,#1/10/2001#,,"The <b>Key</b> of the bar specifies the Z-Order when overlaying."
	End With
	.EndUpdate
End With
|
|
1410
|
Is it possible to specify the z-order when using the overlaying feature
With G2antt1
	.BeginUpdate
	.Columns.Add "Tasks"
	With .Chart
		.NonworkingDays = 0
		.FirstVisibleDate = #9/17/2006#
		.PaneWidth(False) = 64
		.LevelCount = 2
		.Bars.Item("Task").OverlaidType = 4
	End With
	With .Items
		h1 = .AddItem("Task")
		.AddBar h1,"Task",#9/21/2006#,#9/27/2006#,"K1","K1"
		.AddBar h1,"Task",#9/23/2006#,#9/24/2006#,"K2","K2"
		.AddBar h1,"Task",#9/22/2006#,#9/25/2006#,"K3","K3"
		.AddBar h1,"Task",#9/21/2006#,#9/27/2006#,"T1","T1"
		.AddBar h1,"Task",#9/28/2006#,#9/29/2006#,"T2","T2"
		.AddBar h1,"Task",#9/30/2006#,#10/3/2006#,"T3","T3"
		.ItemBar(0,"<T*>",33) = 65280
		.ItemBar(0,"<K*>",52) = "A"
		.ItemBar(0,"<T*>",52) = "B"
	End With
	.EndUpdate
End With
|
|
1409
|
I seen that there is no exBarStartColor, exBarEndColor, similar to exBarColor, is there any solution so I can display a different Start/End Color
With G2antt1
	.BeginUpdate
	With .Chart
		.FirstVisibleDate = #1/1/2001#
		With .Bars.Copy("Summary","Aka1")
			.StartColor = RGB(255,0,0)
			.EndColor = RGB(0,0,255)
		End With
		With .Bars.Copy("Summary","Aka2")
			.StartColor = RGB(0,255,0)
			.EndColor = RGB(255,0,255)
		End With
	End With
	.Columns.Add "Column"
	With .Items
		h = .AddItem("Item A")
		.AddBar h,"Task",#1/2/2001#,#1/6/2001#,"B1"
		.ItemBar(h,"B1",0) = "Aka1"
		h = .AddItem("Item B")
		.AddBar h,"Task",#1/2/2001#,#1/6/2001#,"B2"
		.ItemBar(h,"B2",0) = "Aka2"
	End With
	.EndUpdate
End With
|
|
1408
|
How can copy and paste the selection to Microsoft Word, any OLE compliant application, as a snapshot
With G2antt1
	.BeginUpdate
	.VisualAppearance.Add 1,"c:\exontrol\images\normal.ebn"
	.HTMLPicture("p1") = "c:\exontrol\images\card.png"
	.HTMLPicture("p2") = "c:\exontrol\images\sun.png"
	.AutoDrag = 11
	.LinesAtRoot = 0
	.HasLines = 2
	.ShowFocusRect = False
	.DefaultItemHeight = 26
	.Columns.Add "Task"
	With .Chart
		.ShowNonworkingDates = False
		.FirstVisibleDate = #12/29/2000#
		.PaneWidth(False) = 96
		.LevelCount = 2
		With .Bars.Item("Task")
			.Color = &H1000000
			.Height = 18
		End With
	End With
	With .Items
		h = .AddItem("<img>p1:32</img>Group 1")
		.CellValueFormat(h,0) = 1
		.ItemDivider(h) = 0
		.ItemBold(h) = True
		h1 = .InsertItem(h,,"Task 1")
		.AddBar h1,"Task",#1/2/2001#,#1/4/2001#,"K1"
		h2 = .InsertItem(h,,"Task 2")
		.AddBar h2,"Task",#1/5/2001#,#1/7/2001#,"K2"
		.AddLink "L1",h1,"K1",h2,"K2"
		.Link("L1",12) = "L1"
		h3 = .InsertItem(h,,"Task 3")
		.AddBar h3,"Task",#1/8/2001#,#1/10/2001#,"K3"
		.AddLink "L2",h2,"K2",h3,"K3"
		.Link("L2",12) = "L2"
		h = .AddItem("<img>p2:32</img>Group 2")
		.CellValueFormat(h,0) = 1
		.ItemBold(h) = True
		.ItemDivider(h) = 0
		h1 = .InsertItem(h,,"Task")
		.AddBar h1,"Task",#1/2/2001#,#1/4/2001#,"K1"
		.ExpandItem(0) = True
	End With
	.EndUpdate
End With
|
|
1407
|
How can copy and paste the selection to Microsoft Word, any OLE compliant application, as a image
With G2antt1
	.BeginUpdate
	.HTMLPicture("p1") = "c:\exontrol\images\card.png"
	.HTMLPicture("p2") = "c:\exontrol\images\sun.png"
	.Chart.PaneWidth(True) = 0
	var_HTMLPicture = .HTMLPicture("aka1")
	.HeaderHeight = 24
	.DefaultItemHeight = 48
	.DrawGridLines = -2
	.GridLineColor = RGB(240,240,240)
	.SelBackMode = 1
	.ColumnAutoResize = False
	.ContinueColumnScroll = False
	Set rs = CreateObject("ADOR.Recordset")
	With rs
		.Open "Orders","Provider=Microsoft.ACE.OLEDB.12.0;Data Source=C:\Program Files\Exontrol\ExG2antt\Sample\Access\misc.accdb",3,3
	End With
	.DataSource = rs
	.Columns.Item(0).Def(17) = 1
	.Columns.Item(0).FormatColumn = "value + ` <img>p` + (1 + (value mod 3 ) ) + `</img>`"
	.Columns.Item(0).Width = 112
	.Columns.Item(1).Def(0) = 1
	.Columns.Item(2).LevelKey = "1"
	.Columns.Item(3).LevelKey = "1"
	.Columns.Item(4).LevelKey = "1"
	.AutoDrag = 10
	.SingleSel = False
	With .Items
		h = .ItemByIndex(1)
		.SelectItem(h) = True
		h = .ItemByIndex(2)
		.SelectItem(h) = True
		h = .ItemByIndex(3)
		.SelectItem(h) = True
		.LockedItemCount(2) = 1
		h = .LockedItem(2,0)
		.CellValue(h,1) = "<font ;16>Click the selection and <b>wait to start dragging</b>, and then drop to Microsoft Word, ..."
		.CellSingleLine(h,1) = False
		.CellValueFormat(h,1) = 1
		.CellHAlignment(h,1) = 1
		.ItemDivider(h) = 1
		.ItemDividerLineAlignment(h) = 2
	End With
	.EndUpdate
End With
|
|
1406
|
How can copy and paste the selection to Microsoft Word, Excel or any OLE compliant application, as a text
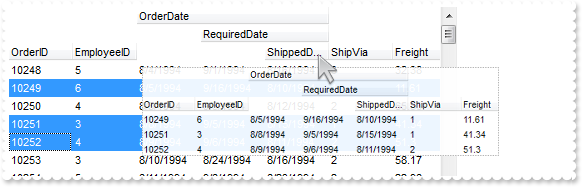
With G2antt1
	.BeginUpdate
	.Chart.PaneWidth(True) = 0
	.ColumnAutoResize = False
	.ContinueColumnScroll = False
	Set rs = CreateObject("ADOR.Recordset")
	With rs
		.Open "Orders","Provider=Microsoft.ACE.OLEDB.12.0;Data Source=C:\Program Files\Exontrol\ExG2antt\Sample\Access\misc.accdb",3,3
	End With
	.DataSource = rs
	.Columns.Item(2).LevelKey = "1"
	.Columns.Item(3).LevelKey = "1"
	.Columns.Item(4).LevelKey = "1"
	.AutoDrag = 9
	.SingleSel = False
	With .Items
		h = .ItemByIndex(1)
		.SelectItem(h) = True
		h = .ItemByIndex(3)
		.SelectItem(h) = True
		h = .ItemByIndex(4)
		.SelectItem(h) = True
		h = .ItemByIndex(5)
		.SelectItem(h) = True
		.LockedItemCount(2) = 1
		h = .LockedItem(2,0)
		.CellValue(h,0) = "<font ;16>Click the selection and <b>wait to start dragging</b>, and then drop to Microsoft Word, Excel, ..."
		.CellSingleLine(h,0) = False
		.CellValueFormat(h,0) = 1
		.CellHAlignment(h,0) = 1
		.ItemDivider(h) = 0
		.ItemDividerLineAlignment(h) = 2
	End With
	.EndUpdate
End With
|
|
1405
|
Is it possible to change the indentation during the drag and drop
With G2antt1
	.BeginUpdate
	.VisualAppearance.Add 1,"c:\exontrol\images\normal.ebn"
	.AutoDrag = 3
	.LinesAtRoot = 0
	.HasLines = 1
	.HasButtons = 3
	.ShowFocusRect = False
	.SelBackMode = 1
	.Columns.Add "Task"
	With .Chart
		.ShowNonworkingDates = False
		.FirstVisibleDate = #12/29/2000#
		.PaneWidth(False) = 128
		.LevelCount = 2
		.Bars.Item("Task").Color = &H1000000
	End With
	With .Items
		h = .AddItem("Group 1")
		.ItemBold(h) = True
		.ItemDivider(h) = 0
		h1 = .InsertItem(h,,"Task 1")
		.AddBar h1,"Task",#1/2/2001#,#1/4/2001#,"K1"
		h2 = .InsertItem(h1,,"Task 2")
		.AddBar h2,"Task",#1/15/2001#,#1/17/2001#,"K4"
		h2 = .InsertItem(h1,,"Task 3")
		.AddBar h2,"Task",#1/5/2001#,#1/7/2001#,"K2"
		.AddLink "L1",h1,"K1",h2,"K2"
		.Link("L1",12) = "L1"
		h3 = .InsertItem(h,,"Task 3")
		.AddBar h3,"Task",#1/8/2001#,#1/10/2001#,"K3"
		.AddLink "L2",h2,"K2",h3,"K3"
		.Link("L2",12) = "L2"
		.ExpandItem(h) = True
		.ExpandItem(h1) = True
		h = .AddItem("Group 2")
		.ItemBold(h) = True
		.ItemDivider(h) = 0
		.LockedItemCount(2) = 1
		h = .LockedItem(2,0)
		.CellValue(h,0) = "Click a row, and move by dragging <b>up, down</b> to change the row's parent or <b>left,right</b> to increase or decrease the i" & _
	"ndentation."
		.CellSingleLine(h,0) = False
		.CellValueFormat(h,0) = 1
	End With
	.EndUpdate
End With
|
|
1404
|
Is it possible to allow moving an item to another, but keeping its indentation
With G2antt1
	.BeginUpdate
	.VisualAppearance.Add 1,"c:\exontrol\images\normal.ebn"
	.AutoDrag = 2
	.LinesAtRoot = 0
	.HasLines = 2
	.ShowFocusRect = False
	.Columns.Add "Task"
	With .Chart
		.ShowNonworkingDates = False
		.FirstVisibleDate = #12/29/2000#
		.PaneWidth(False) = 96
		.LevelCount = 2
		.Bars.Item("Task").Color = &H1000000
	End With
	With .Items
		h = .AddItem("Group 1")
		.ItemDivider(h) = 0
		.ItemBold(h) = True
		h1 = .InsertItem(h,,"Task 1")
		.AddBar h1,"Task",#1/2/2001#,#1/4/2001#,"K1"
		h2 = .InsertItem(h,,"Task 2")
		.AddBar h2,"Task",#1/5/2001#,#1/7/2001#,"K2"
		.AddLink "L1",h1,"K1",h2,"K2"
		.Link("L1",12) = "L1"
		h3 = .InsertItem(h,,"Task 3")
		.AddBar h3,"Task",#1/8/2001#,#1/10/2001#,"K3"
		.AddLink "L2",h2,"K2",h3,"K3"
		.Link("L2",12) = "L2"
		.ExpandItem(h) = True
		h = .AddItem("Group 2")
		.ItemBold(h) = True
		.ItemDivider(h) = 0
	End With
	.EndUpdate
End With
|
|
1403
|
How can I change the row's position to another, by drag and drop. Is it possible
With G2antt1
	.BeginUpdate
	.VisualAppearance.Add 1,"c:\exontrol\images\normal.ebn"
	.AutoDrag = 1
	.Columns.Add "Task"
	With .Chart
		.ShowNonworkingDates = False
		.FirstVisibleDate = #12/29/2000#
		.PaneWidth(False) = 64
		.LevelCount = 2
		.Bars.Item("Task").Color = &H1000000
	End With
	With .Items
		h1 = .AddItem("Task 1")
		.AddBar h1,"Task",#1/2/2001#,#1/4/2001#,"K1"
		h2 = .AddItem("Task 2")
		.AddBar h2,"Task",#1/5/2001#,#1/7/2001#,"K2"
		.AddLink "L1",h1,"K1",h2,"K2"
		.Link("L1",12) = "L1"
		h3 = .AddItem("Task 3")
		.AddBar h3,"Task",#1/8/2001#,#1/10/2001#,"K3"
		.AddLink "L2",h2,"K2",h3,"K3"
		.Link("L2",12) = "L2"
	End With
	.EndUpdate
End With
|
|
1402
|
Is it possible to scroll the control's content by clicking and moving the mouse up or down
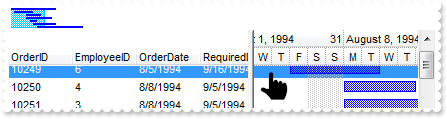
' AddItem event - Occurs after a new Item has been inserted to Items collection.
Private Sub G2antt1_AddItem(ByVal Item As Long)
	With G2antt1
		With .Items
			.AddBar Item,"Task",.CellValue(Item,2),.CellValue(Item,4)
		End With
	End With
End Sub

With G2antt1
	.BeginUpdate
	With .Chart
		.FirstVisibleDate = #8/3/1994#
		.PaneWidth(False) = 256
		.LevelCount = 2
		.UnitScale = 4096
		.FirstWeekDay = 1
		.OverviewVisible = 2
	End With
	.ColumnAutoResize = False
	.ContinueColumnScroll = False
	Set rs = CreateObject("ADOR.Recordset")
	With rs
		.Open "Orders","Provider=Microsoft.ACE.OLEDB.12.0;Data Source=C:\Program Files\Exontrol\ExG2antt\Sample\Access\misc.accdb",3,3
	End With
	.DataSource = rs
	.AutoDrag = 16
	.EndUpdate
End With
|
|
1401
|
How can I display bars so they fit the entire height ( height of the row )
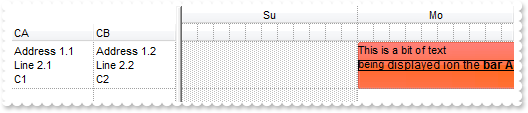
With G2antt1
	.BeginUpdate
	.VisualAppearance.Add 1,"c:\exontrol\images\normal.ebn"
	.DefaultItemHeight = 36
	With .Chart
		.PaneWidth(False) = 164
		.FirstVisibleDate = #1/1/2001#
		.UnitWidth = 48
		.LevelCount = 2
		.UnitScale = 65536
		.NonworkingHours = 16253183
		.ShowNonworkingUnits = False
		.UnitWidth = 16
		.FirstVisibleDate = #1/1/2012 8:00:00 AM#
		.DrawGridLines = -1
		.Bars.Add("Empty").Pattern = 0
		With .Level(0)
			.Alignment = 17 ' AlignmentEnum.exHOutside Or AlignmentEnum.CenterAlignment
			.Label = "<%d2%>"
		End With
		.AllowLinkBars = False
		.AllowCreateBar = 0
		.BarsAllowSizing = False
		.AllowSelectObjects = 0
	End With
	.DrawGridLines = -1
	.ShowFocusRect = False
	With .Columns
		With .Add("CA")
			.Def(16) = False
			.Def(17) = 1
		End With
		With .Add("CB")
			.Def(16) = False
			.Def(17) = 1
		End With
	End With
	With .Items
		h = .AddItem("Address 1.1<br>Line 2.1<br>C1")
		.ItemMaxHeight(h) = 96
		.CellValue(h,1) = "Address 1.2<br>Line 2.2<br>C2"
		.AddBar h,"Empty",#1/2/2012 8:00:00 AM#,#1/2/2012 7:00:00 PM#,"A","This is a bit of text<br>being <font ;9>displayed ion the <b>bar A"
		.ItemBar(h,"A",7) = 16777471
		.ItemBar(h,"A",4) = 0
		.ItemBar(h,"A",5) = 2
		.AddBar h,"Empty",#1/3/2012 8:00:00 AM#,#1/3/2012 7:00:00 PM#,"B","<fgcolor=FFFFFF>This is a bit of text<br><fgcolor=FFFFFF>being <font ;9>displayed ion the <b>bar B"
		.ItemBar(h,"B",7) = 33488896
		.ItemBar(h,"B",4) = 2
		.ItemBar(h,"B",5) = 0
		.AddBar h,"Empty",#1/4/2012 8:00:00 AM#,#1/4/2012 7:00:00 PM#,"C","<font Tahoma;12><b>bar C"
		.ItemBar(h,"C",7) = 33489151
	End With
	.EndUpdate
End With
|